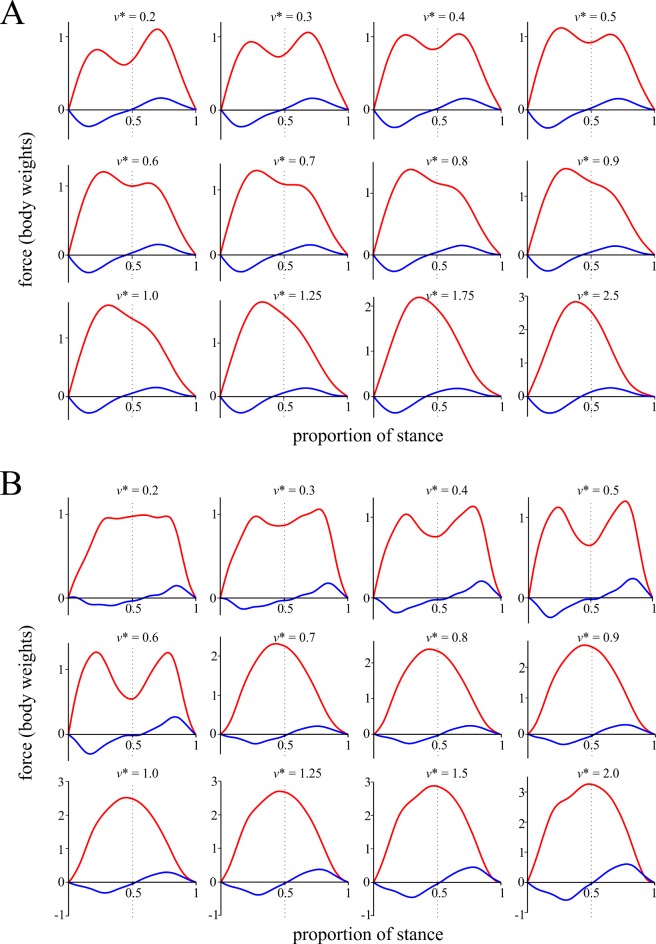
Fig 8. Change in the shape of the GRF force-time profiles with increasing speed.
(A) Pattern of change observed in birds. (B) Pattern of change observed in humans. Red profile is vertical component, blue profile is anteroposterior component. Among other things, note how the profiles for birds show marked temporal asymmetry compared to those of humans, with more force being applied in the first half of stance. For humans, force-time profiles were calculated from least squares linear fits applied to the respective data, with the exception of Za2 for walking, which was better fit by a power II model. The predicted curves for both components are based on the first ten sine coefficients (i.e., Xa1–Xa10, Za1–Za10), all of which either showed significant variation with speed or significantly non-zero values (or both).

