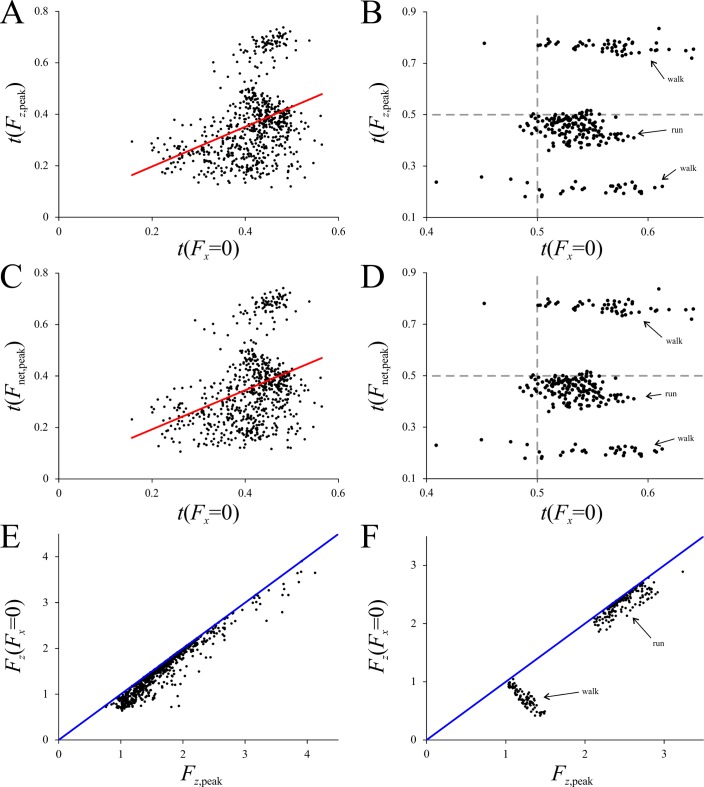
Fig 11. The association, or lack thereof, between t(Fz,peak) or t(Fnet,peak) and t(Fx = 0).
(A, B) t(Fz,peak) versus t(Fx = 0). (C, D) t(Fnet,peak) versus t(Fx = 0). (E, F) Fz(Fx = 0) compared to Fz,peak for each trial; the blue lines are lines of parity. (A), (C) and (E) are for birds, (B), (D) and (F) are for humans. In (A), the regression line has a slope of 0.7718 and an r2 of 0.1289; in (C), the regression line has a slope of 0.7627 and an r2 of 0.1194. In human walking, peak vertical or net force either occurs early or late in the stance; in running, they occur largely before mid-stance (t < 0.5), yet t(Fx = 0) largely occurs after mid-stance (t > 0.5).

