. 2018 Feb 9;7:e34864. doi: 10.7554/eLife.34864

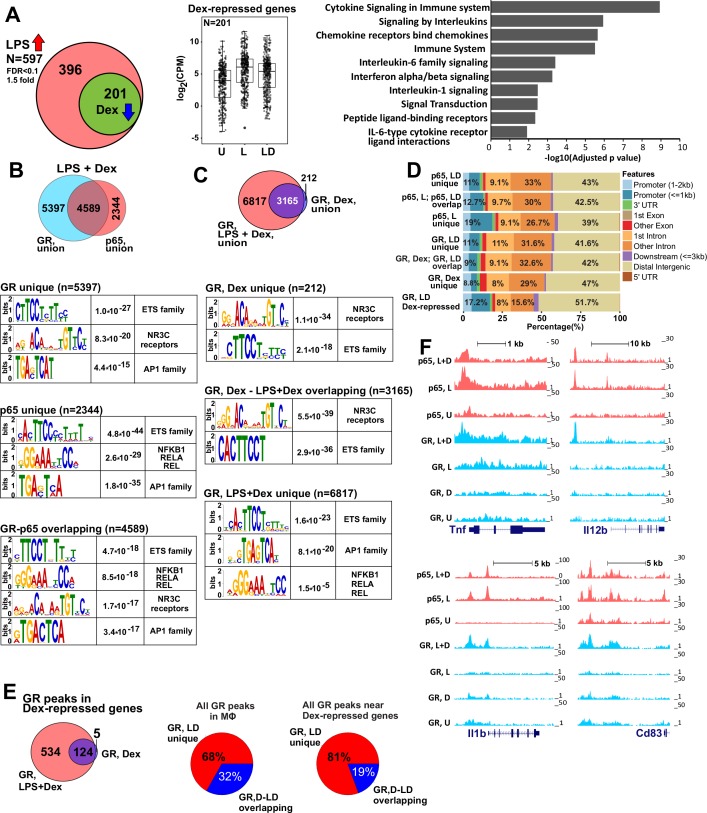
Figure 1. GR represses LPS-induced genes via p65-assisted tethering.

(A) Over 30% of LPS-induced genes (597) in BMDM are repressed by Dex (201; Venn diagram and normalized expression values) and show a pro-inflammatory gene signature (GO analysis). BMDM were untreated (U) or treated with 10 ng/ml LPS ±100 nM Dex (L and LD) for 1 hr, and gene expression levels were determined by RNA-seq (n = 2). (B) The overlap between ChIP-seq peak calls for GR and p65 in LPS + Dex-treated BMDM (Venn diagram) was determined using subsetByOverlap function from GenomicRanges package (Bioconductor) with the minimum overlap of 1 nt (see Materials and methods). Ab initio sequence motif discovery and over-representation in each subset of GR or p65 binding peaks was determined using MEME-ChIP (Ma et al., 2014). E-values for the enrichment of the motif are shown. (C) Dex- and LPS + Dex-induced GR ChIP-seq peaks are shown (Venn diagram). LPS + Dex unique peaks are enriched for NF-kB-binding sites as indicated by MEME-ChIP analysis as in B. (D) Genomic location of p65 and GR binding sites relative to known genomic features is determined by ChIPpeakAnno (Bioconductor) (Zhu et al., 2010). (E) The distribution of GR-binding sites located in a 200 Kb region centered on LPS-induced Dex-repressed genes in BMDM treated with Dex or LPS + Dex (left). Pie-charts show the % of LD-unique GR peaks either genome-wide (center) or those associated with LPS-induced Dex-repressed genes only (right). (F) GR and p65 ChIP-seq read density profiles of representative LPS-induced Dex-repressed genes are shown for untreated (U), LPS (L) or LPS + Dex (L + D) treated BMDM. Also see Figure 1—figure supplements 12 and Supplementary files 1 and 2.

Figure 1.

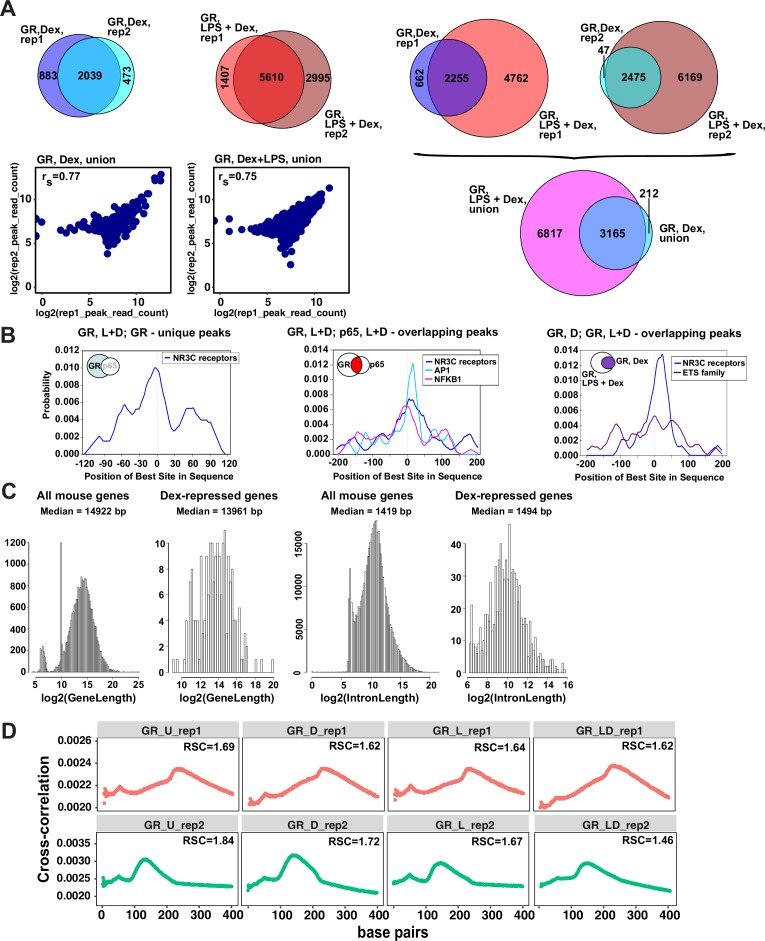
Figure 1—figure supplement 1. Characterization of GR cistromes in Dex- and LPS + Dex-treated BMDM.

Figure 1—figure supplement 1.

(A) Venn diagram comparison of GR peak sets from ChIP-seq replicates in BMDM treated as indicated (left) and between treatments (right). The union of peak sets was constructed for each condition. Read counts were determined for each peak in condition-specific peak union sets for each replicate; a plot of log transformed per peak read counts for GR replicas is shown for each treatment condition; rs - Spearman’s correlation between replicas (left, bottom). (B) The centrality enrichment analysis of binding motifs identified by ab initio prediction with MEME was performed using CentriMo program of MEME suite. Significant distribution profiles relative to the peak midpoint are shown for several subsets of peaks identified by GR and p65 ChIP-seq. Left: GR-unique peaks from GR:p65 cistromes in LPS + Dex treated BMDM (Figure 1B). Middle: GR, L + D peaks overlapping p65, L + D peaks. Right: GR, D peaks overlapping GR, L + D peaks (Figure 1C). (C) Distribution of gene and intron length in Dex-repressed genes compared to all expressed genes in mouse BMDM. (D) Cross-correlation plots for GR ChIP-seq datasets generated in this study. Relative strand cross-correlations were calculated using CLC BIO Genomics Workbench.
Figure 1—figure supplement 2. Characterization of p65 cistromes in LPS- and LPS +Dex treated BMDM.

Figure 1—figure supplement 2.

(A) Venn diagram comparison of p65 peak sets from ChIP-seq replicates in BMDM treated as indicated (left) and between treatments (right). The union of peak sets was constructed for each condition. Read counts were determined for each peak in condition-specific peak union sets; a plot of log transformed per peak read counts for p65 replicas is shown for each treatment condition; rs - Spearman’s correlation between replicas (left, bottom). (B) p65 peaks distribution in LPS- and LPS + Dex-treated BMDM near Dex-repressed genes from Figure 1A (±100 Kb) (C) Cross-correlation plots for p65 ChIP-seq datasets generated in this study. Relative strand cross-correlations were calculated using CLC BIO Genomics Workbench.