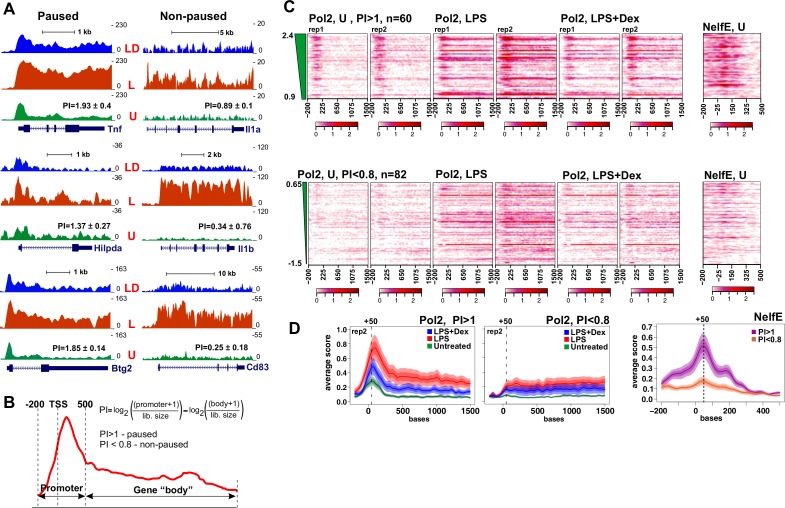
Figure 2. Pol 2 and NELF dynamics at different classes of GR-sensitive genes.
(A) Pol 2 ChIP-seq read density profiles and pausing indexes (PI) for representative paused and non-paused genes in the untreated (U), LPS (L) and LPS +Dex (LD) treated BMDM. (B) PI (a ratio of Log-transformed Pol 2 counts at the promoter and gene body in untreated BMDM) was calculated for all LPS-induced Dex-repressed transcript variants with unique 5’ ends (see Materials and methods). Genes with PI >1 were considered paused and those with a PI <0.8 non-paused. (C) Pol 2 ChIP-seq heat maps of paused (n = 62) and non-paused (n = 82) transcripts sorted by the PI indexes corresponding to 198 Dex-repressed genes (see Materials and methods) are shown for the U, L and L + D conditions for each individual replica. Only transcripts overlapping Pol 2 peaks in LPS-treated BMDMs as determined by MACS2 are shown. NELF-E heat maps from U BMDM ChIP-seq for the same transcript classes are shown on the right. Heat maps scales are equalized to visualize Pol 2 and NELF distribution across the genes; color scale bars are shown below corresponding maps. (D) Average Pol 2 (in each treatment condition) and NELF-E (untreated BMDM) occupancy for each gene class defined in C. The confidence band shows the SEM and 95% confidence interval. Also see Supplementary files 2 and 3.

