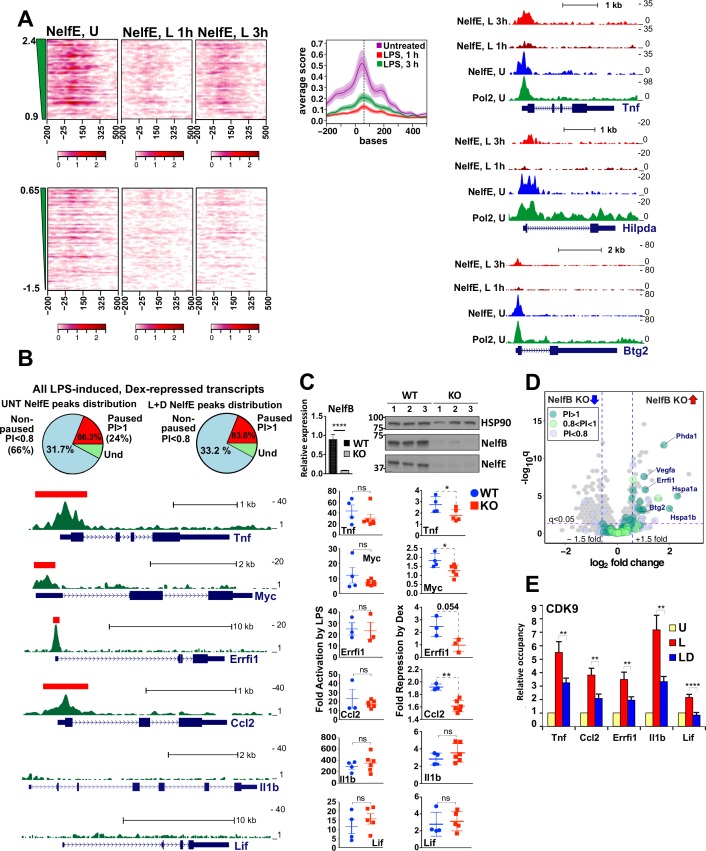
Figure 3. Gene-class-specific contribution of NELF to GR-mediated repression.
(A) Heat maps show NELF-E occupancy in the U (from Figure 2C), 1 and 3 hr L-treated BMDM for paused and non-paused transcripts. Average occupancy for the paused genes in each condition is graphed as in Figure 2D. Representative examples of Pol 2 and NELF ChIP-seq read density profiles are shown on the right. (B) Pie charts show the percentage of all paused (24%) and non-paused (66%) LPS-induced Dex-repressed genes that exhibit promoter-proximal NELF-E binding in the UNT (86.3% and 31.7%, respectively) and L + D conditions (83.6% and 33.2%, respectively). NELF-E ChIP-seq read density profiles for the L + D condition are shown for a set of representative genes. Red rectangles in Tnf, Myc, Errfi1 and Ccl2 profiles indicate MACS2 NELF-E peaks in the L + D condition. (C) NELF-B KO mice were generated as described in Methods. NELF-B RNA in WT and KO BMDM was quantified by RT-qPCR and normalized to Actb (n = 5, p<0.0001, two-tailed Student’s t-test; error bars are SEM). For western blots, three mice per genotype were used to visualize NELF-B, NELF-E and HSP90 as a loading control (top). Bottom: WT and NELF-B KO BMDM were U or treated with L-/+D for 30 min (Tnf) or 1 hr (all others) and the expression of indicated genes (matching those in B) was assessed by RT-qPCR, normalized to Actb, and shown as ‘fold activation by LPS’ over basal levels (=1) and ‘fold repression by Dex’ (a ratio of L over L + D level of each transcript). *p<0.05, **p<0.01 (Two-tailed Student’s t-test). Error bars are SEM. (D) The volcano plot comparing gene expression in L + D (1 hr) treated BMDM from the WT vs. NELF-B KO mice (n = 3) (fold change = 1.5, FDR p<0.05). Pausing indices (PI) of 201 LPS-induced Dex-repressed genes from Figure 1A are shown in color. (E) CDK9 occupancy at selected genes in BMDM treated for 1 hr as indicated. n = 4–9. **p<0.01, ****p<0.001 (two-tailed Student’s t-test). Error bars are SEM. Also see Figure 3—figure supplement 1 and Supplementary file 2.


