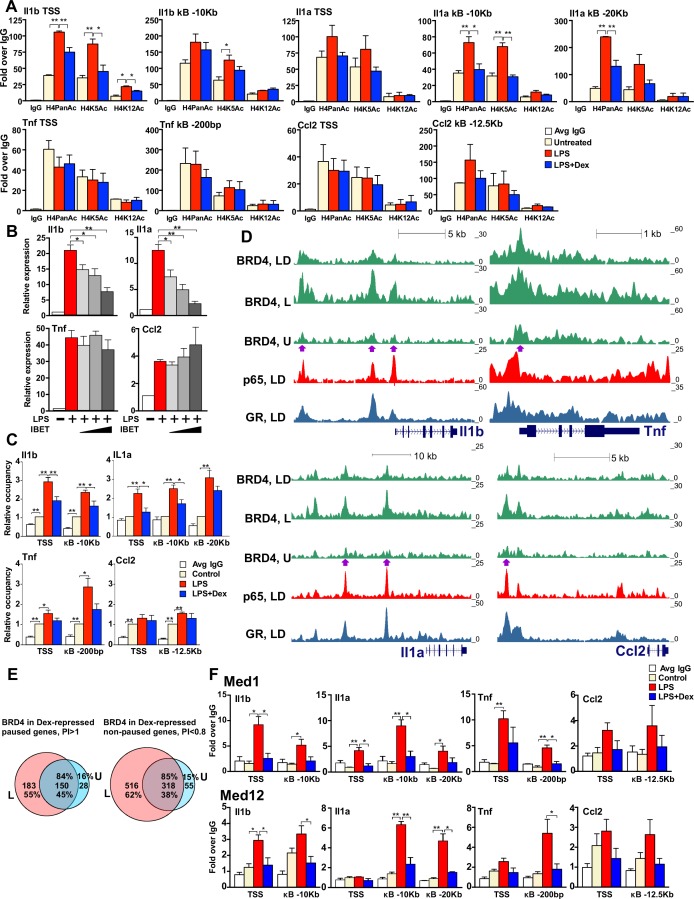
Figure 4. GR inhibits H4 acetylation, BRD4 and Mediator assembly at non-paused genes.
(A) BMDM were treated as indicated, and H4PanAc, H4K5Ac and H4K12Ac at the TSS and indicated kB sites were assessed by ChIP. qPCR signals were normalized to r28S gene and expressed as relative enrichment over normal IgG (=1). A two-tailed Student’s t-test was used for comparing means (n ≥ 3; *p<0.05, **p<0.01). Error bars are SEM. (B) BMDM were pre-treated with I-BET (10 nM, 100 nM, 1 μM) for 30 min followed by addition of LPS for 30 more min. Gene expression was assessed by RT-qPCR and normalized to that of Actb. A two-tailed Student’s t-test was used for comparing means (n ≥ 3; *p<0.05, **p<0.01). Error bars are SEM. (C) BRD4 occupancy was assessed by ChIP-qPCR as in A with IgG ChIP as a background metric and expressed as relative enrichment over untreated for each site (=1). A two-tailed Student’s t-test was used for comparing means (n ≥ 3, *p<0.05, **p<0.01). (D) ChIP-seq read density profiles for BRD4, GR and p65 in the U, L or L + D treated BMDM. Purple arrows indicate peaks specifically noted in Results. (E) Venn diagrams show overlapping BRD4 peaks for Dex-repressed paused and non-paused genes in the U and L condition. Overlapping peaks were determined as described in Figure 1 and Materials and methods. (F) Med1 and Med12 occupancy is analyzed by ChIP-qPCR as in A (n ≥ 3). Also see Figure 4—figure supplement 1 and Supplementary file 2.


