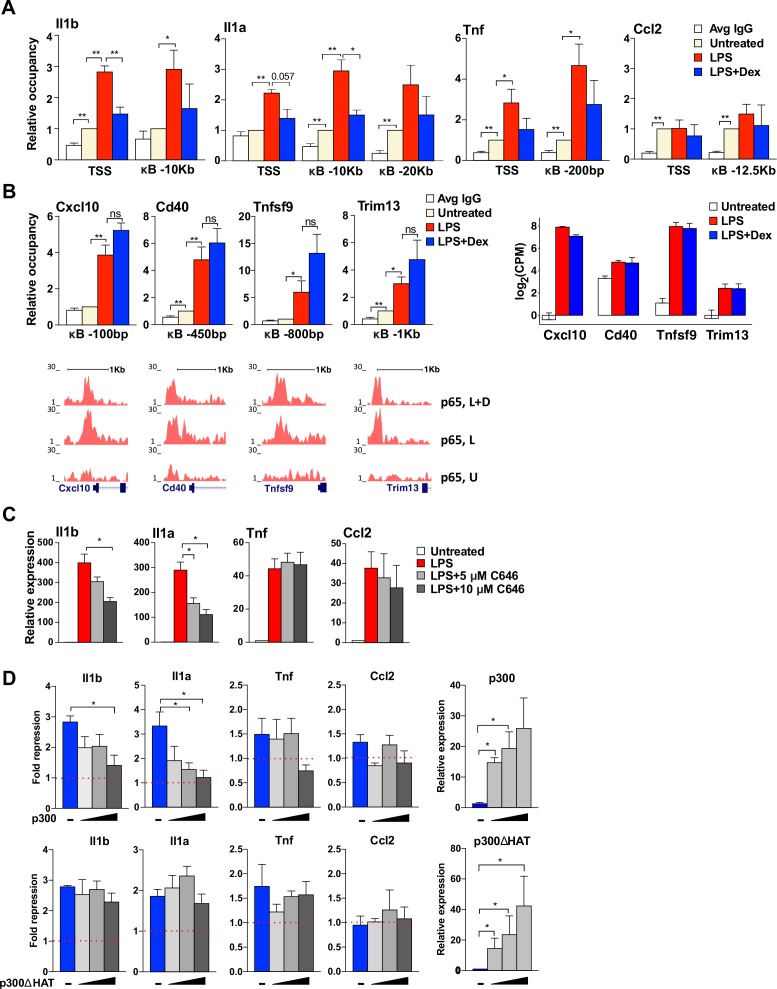
Figure 5. GR-mediated repression of non-paused genes is associated with the diminished p300 function.
(A) p300 occupancy at indicated kB-binding sites is evaluated as in Figure 4C (n ≥ 3). (B) p300 occupancy at indicated kB binding sites is evaluated as in A (n ≥ 3; top panel). p65 ChIP-seq read density distribution in U-, L- or L + D-treated BMDM for corresponding kB-binding sites is shown (bottom panel). Expression level (log(CPM) values) for LPS-induced Dex-insensitive genes as determined by RNA-seq in Figure 1A for the WT BMDM (untreated, LPS 1 hr, L + D 1 hr, n = 2, right panel). (C) BMDM were treated with LPS for 30 min followed by addition of 5 μM or 10 μM C646 for another 1 hr. The expression of indicated genes was assessed as described in Figure 4B (n ≥ 3). (D) RAW264.7 cells were transfected with increasing amounts of pcDNA3-p300 or pcDNA3-p300(ΔHAT) (0, 50, 100 and 150 ng/well) as described in Materials and methods. Cells were treated with 100 ng/ml LPS ±100 nM Dex for 1 hr. Gene expression was analyzed as described in Figure 3C (n ≥ 3).

