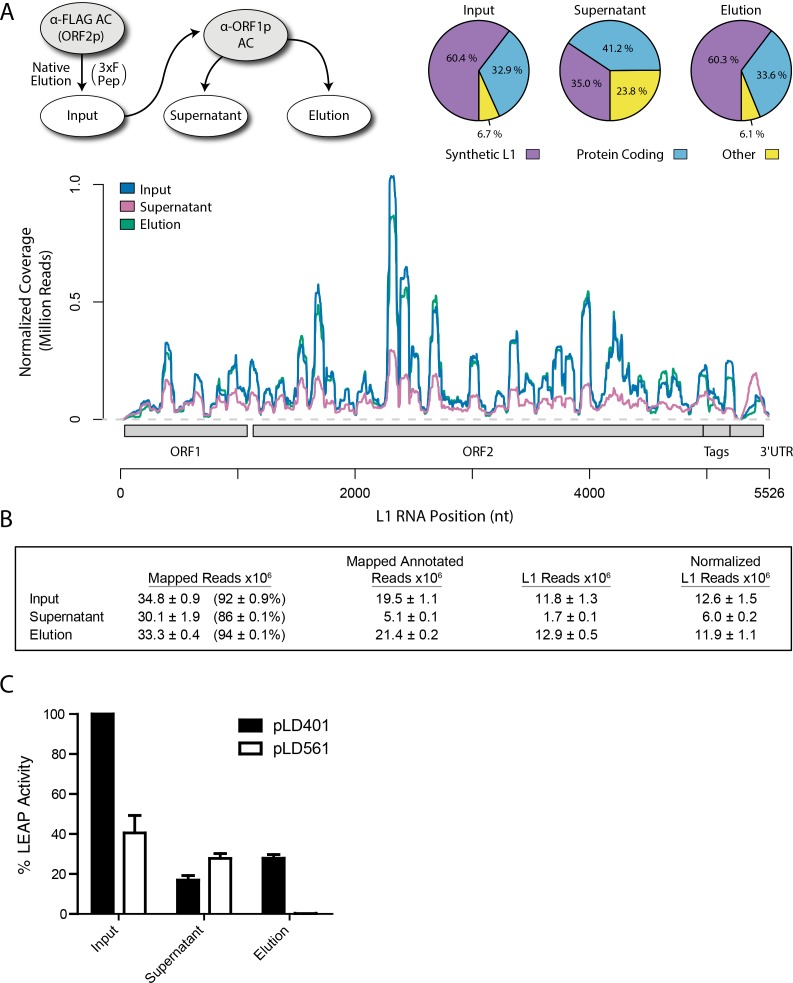
Figure 2. Transcriptomic and enzymatic analysis of split-tandem RNP fractions.
(A) RNA sequencing affinity captured L1s: L1 complexes were obtained by split-tandem affinity capture, as in Figure 1D (simplified schematic shown); RNA extracted from these three fractions was subjected to next-generation sequencing. The results are summarized with respect to coverage of the synthetic L1 sequence (see schematic with nucleotide coordinates) as well as the relative quantities of mapped, annotated reads (pie charts; the mean of duplicate experiments is displayed). (B) Summary of sequencing reads: displays the total number of sequencing reads that mapped to our reference library, the subset of mapped reads carrying a genome annotation, and the number of reads that corresponding to L1, both raw and normalized (see Materials and methods and Supplementary file 4). The mean of duplicate experiments is displayed; ±indicates the data range. (C) LINE-1 element amplification protocol (LEAP) of affinity captured L1s: L1 complexes were obtained from full length synthetic L1 (pLD401) and an otherwise identical ΔORF1 construct (pLD561) following the same experimental design as in (A), except that elution from α-ORF1p affinity medium was done natively, by competitive elution. In this assay, L1 cDNAs are produced, in cis, by ORF2p catalyzed reverse transcription of L1 RNAs; the resulting cDNAs by were measured by quantitative PCR and presented as relative quantities normalized to pLD401 input (Supplementary file 4). The mean of duplicate experiments is displayed; error bars indicate the data range.

