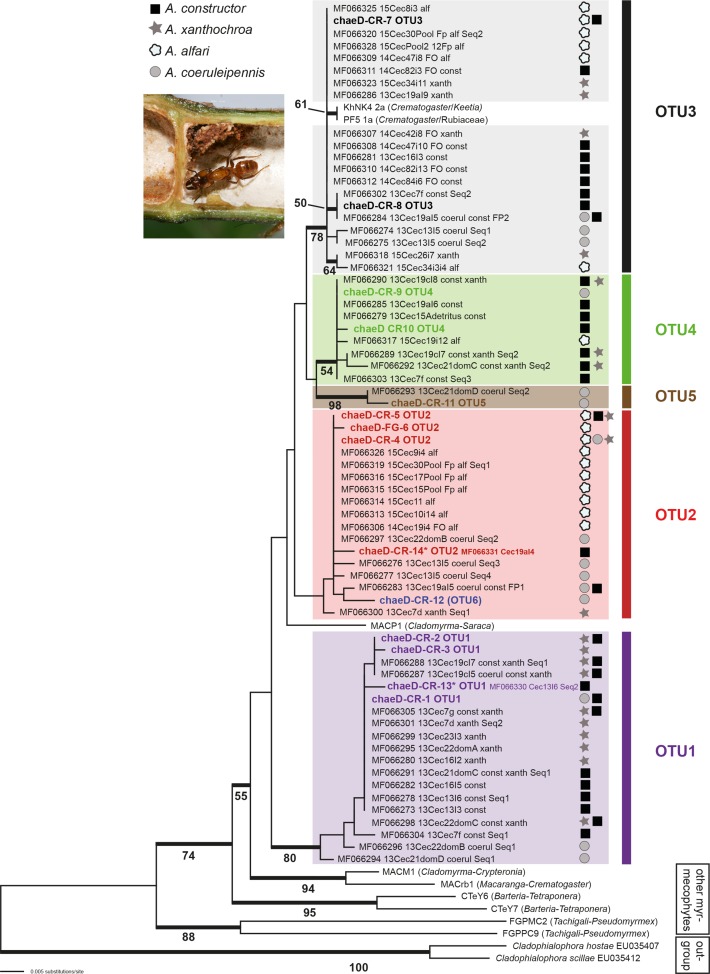
Fig 2. Molecular phylogenetic analysis of fungal genotypes associated with patches from Azteca foundress queens.
A maximum likelihood analysis of the ITS matrix was performed with MEGA7 [36], showing the best tree (-lnL = 1906.92) based on the Kimura 2-parameter (K2) model [37], applying a discrete Gamma distribution (+G; 5 categories, parameter = 0.4209) and a proportion of evolutionarily invariable sites (+I; 41.37% sites). The tree is drawn to scale, with branch lengths measured in the number of substitutions per site. Bold branches indicate ML bootstrap support above 50%.

