
Figure 2.
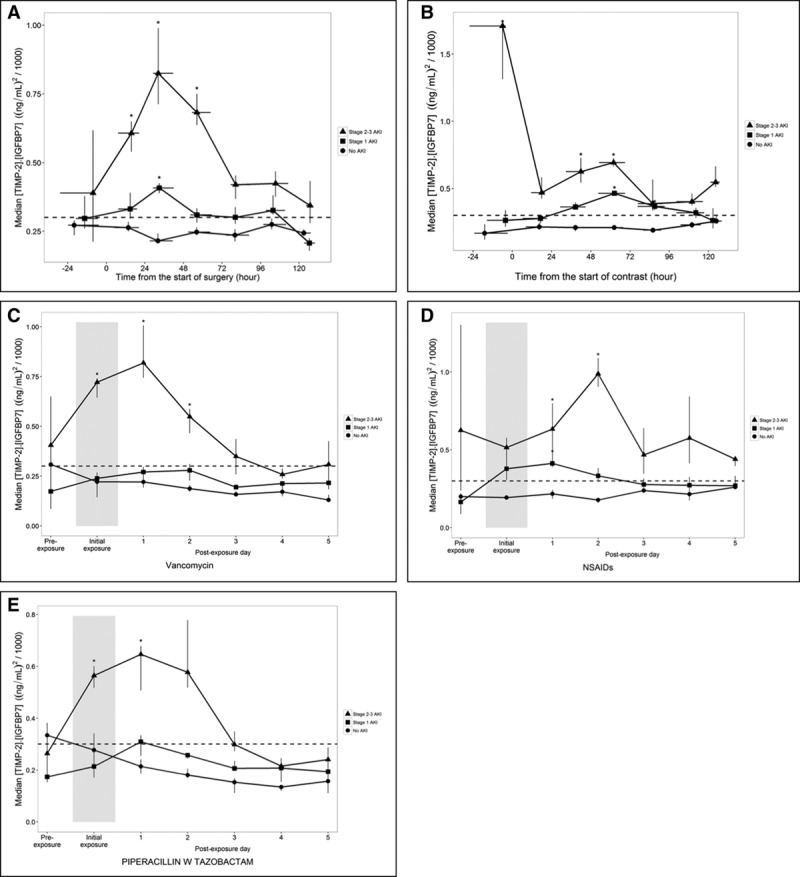
Biomarker kinetics in association with specific exposures. Time course of urinary tissue inhibition of metalloproteinase [TIMP-2]•insulin-like growth factor binding protein [IGFBP7] concentrations relative to the time or day of exposure by acute kidney injury (AKI) stage for patients exposed to major surgery (A), IV contrast (B), vancomycin (C), NSAIDs (D), or piperacillin/tazobactam (E). Symbols show median urinary [TIMP-2]•[IGFBP7] concentrations for patients who had no AKI (circles), AKI stage 1 (squares), and AKI stage 2–3 (triangles) within 3 days postexposure. Vertical and horizontal lines through the symbols show the interquartile range of bootstrap medians for the [TIMP-2]•[IGFBP7] concentrations and the time from exposure, respectively. Median urinary [TIMP-2]•[IGFBP7] concentrations are shown by day for drug exposures because only the day and not the time of exposure was recorded. The width of the shaded area indicates the day of the first dose of each drug.