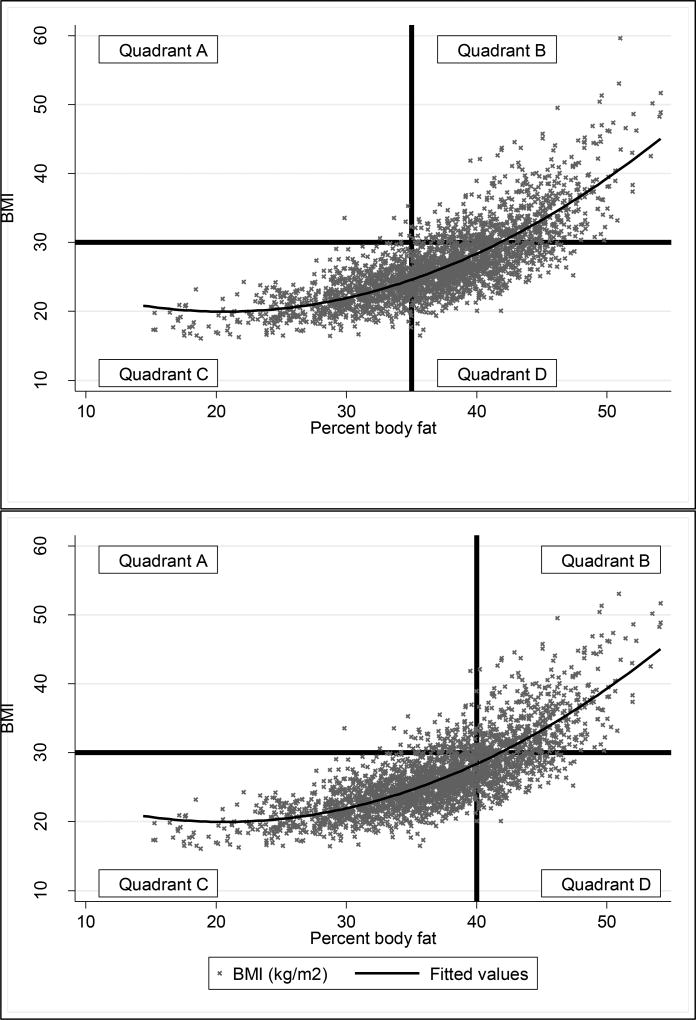
Figure 1.
a–b. Scatterplots comparing BMI (kg/m2) with percent body fat (%). The black horizontal line represents BMI greater than 30 kg/m2. The curved line represents a quadratic prediction line. The vertical line indicates percent body fat greater than 35% (Figure 1a) and 40% (Figure 1b). Participants in Quadrants A and D are misclassified, participants in Quadrants B and C are correctly classified. In Figure 1a, 0.26% of women are in quadrant A, 21% are in quadrant B, 34% are in quadrant C, and 44% are in quadrant D. In figure 1b, 3.7% are in quadrant A, 18% are in quadrant B, 64% are in quadrant C, and 14% in quadrant D.

