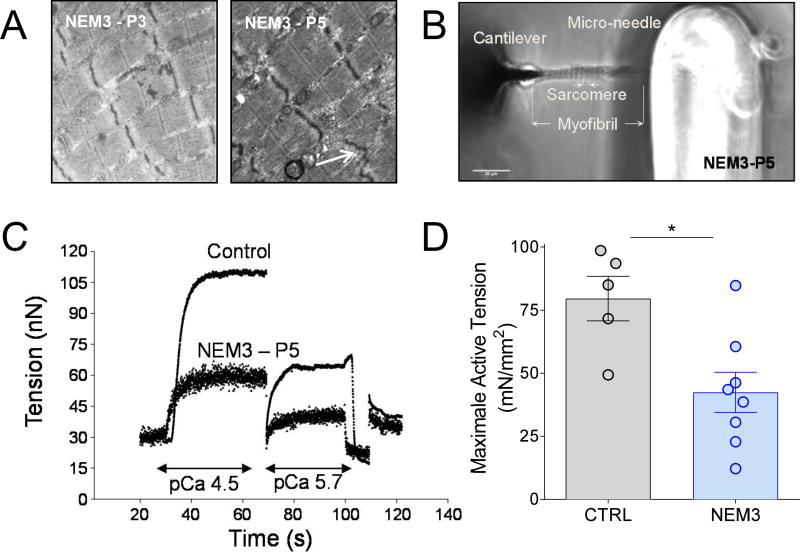
Figure 4.
Electron microscopy images of muscle fibers of two NEM3 patients, presenting areas of preserved myofibrillar structure, but also mild Z-line irregularities (B, indicated by an arrow). (B) Photograph of a myofibril (NEM3-P5) mounted between a microneedle and a cantilever to measure its contractility; (C) Typical force trace showing that the force generating capacity of a myofibril of a NEM3 patient (P5) at different Ca2+ concentrations (pCa 4.5 and 5.7) and of a control subject; (D) Maximal active tension is lower in NEM3 patients compared to control subjects.

