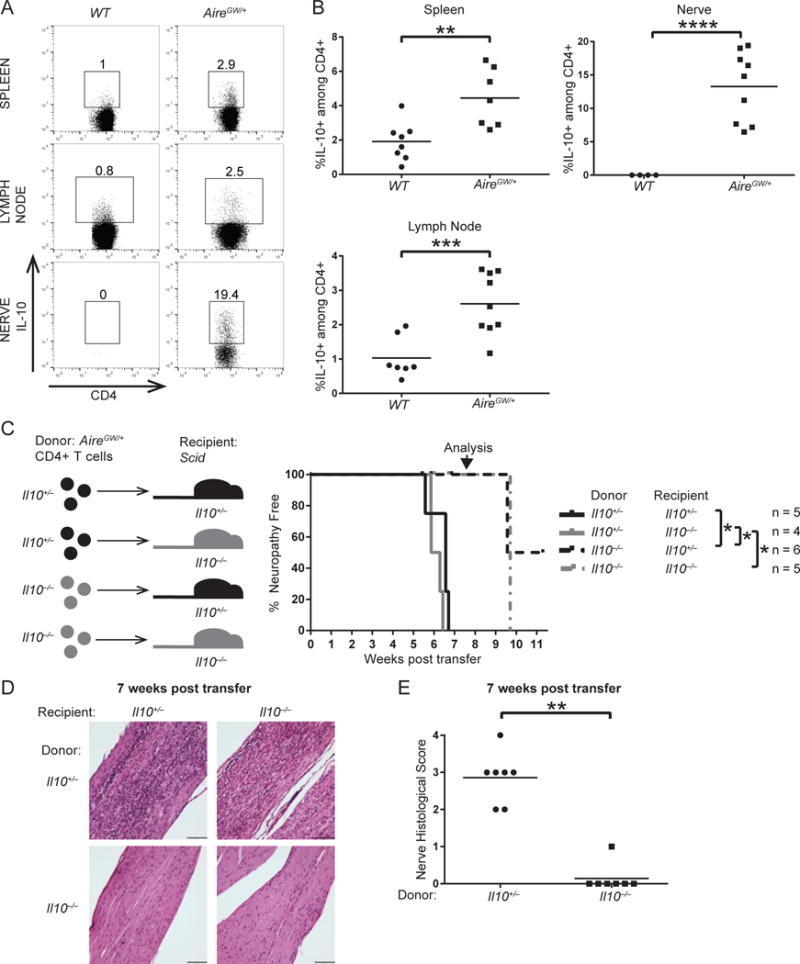
Figure 3. IL-10 produced by CD4+ T cells promotes SAPP.

Spleens, lumbar lymph nodes, and sciatic nerves of 22-wk-old WT mice and AireGW/+ mice stained for intracellular IL-10. (A) Flow cytometry plots of CD4+ T cells. Gated on lymphocytes, singlets, and live cells. Numbers on plots represent frequencies of IL-10-expressing cells. (B) Cumulative frequencies of CD4+IL-10+ T cells. p-values were calculated using two-tailed unpaired Student’s t test with Welch’s correction; **, p < 0.01, ***, p < 0.001, ****, p < 0.0001. (C) Schematic (left) and SAPP incidence curve (right) of NOD.Scid Il10+/− or NOD.Scid Il10−/− recipient mice receiving purified CD4+ T cells adoptively transferred from 22-wk-old AireGW/+ Il10+/− or AireGW/+ Il10−/− donor mice. p-values were calculated using Mantel-Cox log-rank test with false discovery rate adjustment for multiple comparisons; *, p < 0.05. Arrow points to time when nerves were harvested for histology. (D) H&E-stained sciatic nerves harvested 7 weeks post CD4+ T cell adoptive transfer from the groups described in C. (magnification 200×). Scale bar = 98 μm. (E) Cumulative infiltration scores of sciatic nerves from recipient mice 7 weeks post transfer. Grouped by donor genotype. p-value was calculated using Fisher’s Exact test; **, p < 0.01.
