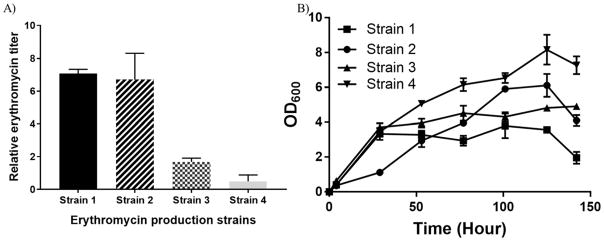
Figure 3.
Erythromycin production across different strains. Relative erythromycin titer (A; measure at final time point) and optical density at 600 nm (OD600; B) comparison. Strain 1: TB3 (pBPJW130/pBPJW144/pJM03/pJM02/pGro7); Strain 2: LF01(pDEBS/pTailoring); Strain 3: TB3(pDEBS/pTailoring); Strain 4: LF05(pDEBS/pTailoring). Error bars represent standard deviation values from three independent experiments.

