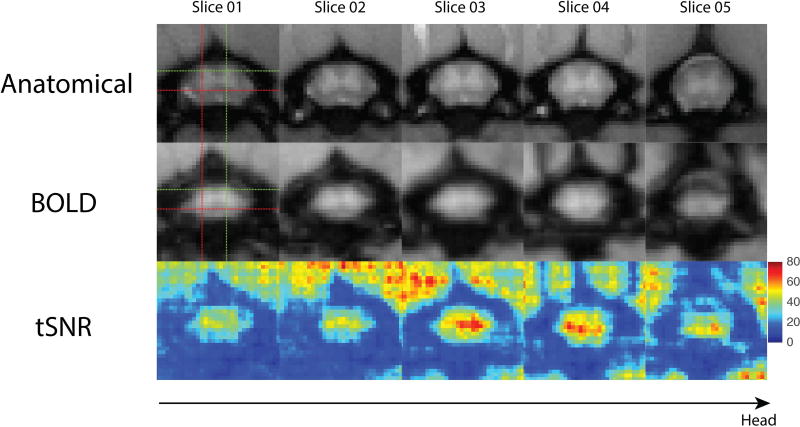
Figure 2.
Anatomical, functional blood oxygenation level dependent (BOLD) and temporal signal-to-noise- ratio (tSNR) maps across five slices. (A) Enlarged views of the cervical spinal cord using magnetization transfer contrast (MTC). Imaging planes of the five slices correspond to the red boxes in Figure 1. (B) Pre-processed functional BOLD images of the same five slices. Goodness of alignments between anatomical and functional images are indicated by the crosshair pointing to the same left ventral horn (red) and right dorsal horn (green). (C) TSNR maps of the functional images presented in B.

