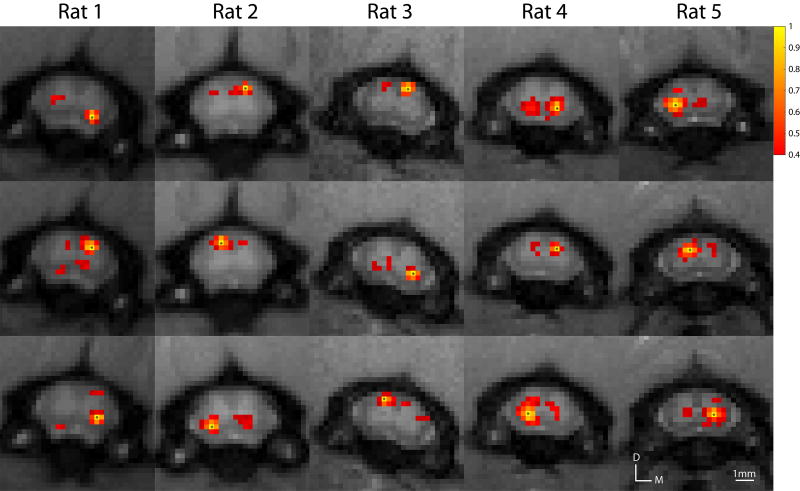
Figure 4.
Examples of within-slice resting-state correlation maps in the cervical spinal cord across all five animals. Correlation maps were thresholded (Pearson’s correlation coefficient, r > 0.4) and the yellow voxels with asterisks indicate seed voxels. A minimum cluster threshold of 2 voxels was also used to prevent any spurious correlations. D: dorsal; M: medial.

