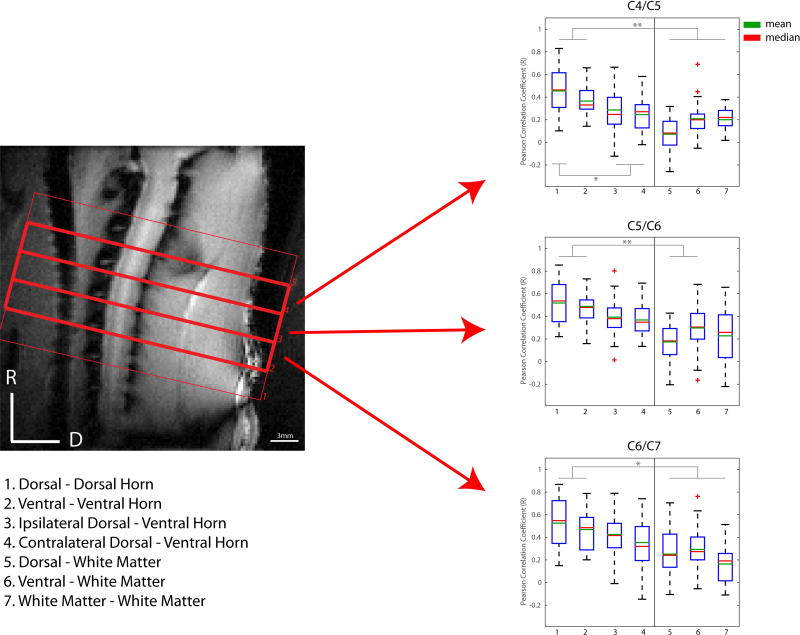
Figure 5.
Group analysis of functional connectivity between spinal cord gray matter horns and “control” white matter regions. (Left) Sagittal MTC image of the rat cervical spinal cord. (Right) Boxplots of correlation strengths between seven ROI pairs in C4/C5 (top), C5/C6 (middle) and C6/C7 (bottom) of the spinal cord. Corresponding slices of each cervical spinal region are indicated by red arrows. *p<0.05, **p<0.005 (non-parametric Mann-Whitney test, Bonferroni corrected). The red crosses represent outlier data points.

