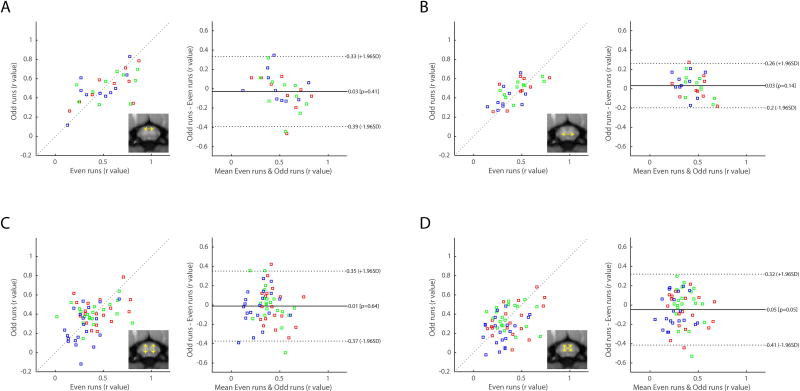
Figure 6.
Reproducibility and agreement of within-slice horn-to-horn functional connectivity. Functional connectivity measurements were divided into two sub-groups that consist of even and odd runs for each animal. (Left of each subplot) Correlation strengths in even runs were then plotted against those in odd runs. To quantitatively measure reproducibility, the cross correlation values (Pearson’s coefficient, r) are computed to be 0.61 (p=4.59×10⁻⁴) for (A) dorsal-dorsal connectivity, 0.67 (p=6.71×10⁻⁵) for (B) ventral-ventral connectivity, 0.25 (p=0.0593) for (C) ipsilateral dorsal-ventral connectivity, and 0.37 (p=0.0044) for (D) contralateral dorsal-ventral connectivity. (Right of each subplot) Bland-Altman plots of horn-to-horn connectivity. Solid lines represent the mean differences between the two subsets, while the dotted lines are 95% limits of agreement. Blue dots denote values from the inferior slice (C4/C5, slice04), green denotes values from the middle slice (C5/C6, slice03), and red dots denote values from the superior slice (C6/C7, slice02).

