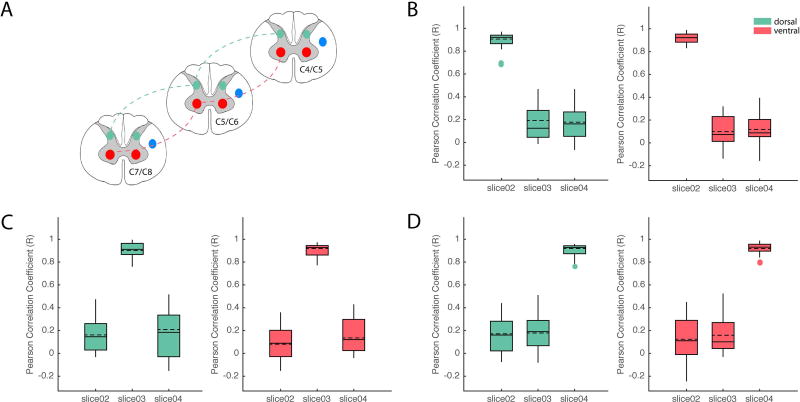
Figure 7.
Group analysis of functional connectivity between spinal cord gray matter horns across different spinal segments. (A) Schematic diagram modified from Chen et al. (22) that illustrates pair-wise correlation analyses with respect to seed ROI in LVH (red lines) and LDH (green lines). (B) Group boxplots of correlation strengths between ROI in slice 2 and those in slices 3 and 4 for both LVH (red shaded boxplots) and LDH (green shaded boxplots). Similarly, correlation strengths were computed and displayed as group whisker boxplots with respect to seeds in slices 3 (C) and 4 (D). Solid and dashed horizontal lines inside each boxplot indicate the median and mean respectively. Shaded boxplots were generated using gramm (48).

