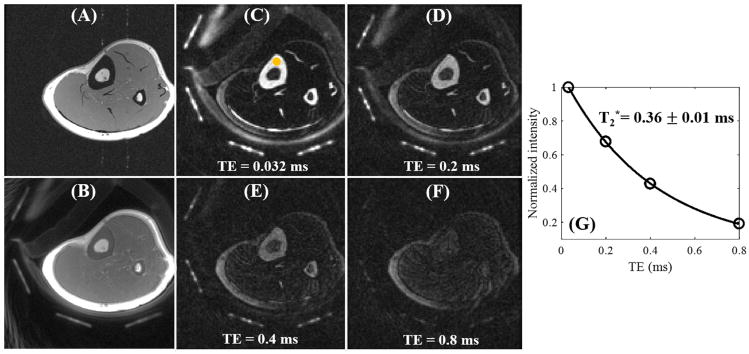
Figure 4.
In vivo imaging of the left leg of a 29-year-old male volunteer with a clinical 3D GRE sequence where cortical bone shows as a pure signal void (A). The basic 3D UTE-Cones sequence shows cortical bone signal, but with low contrast (B). The 3D DIR-UTE-Cones sequence shows simultaneous suppression of muscle and marrow fat, providing excellent image contrast for cortical bone, tendons and aponeurosis with TEs of 0.032 ms (C), 0.2 ms (D), 0.4 ms (E), and 0.8 ms (F). Excellent single-component fitting was achieved for tibial midshaft cortex with a short T2* of 0.36 ± 0.01 ms (G).

