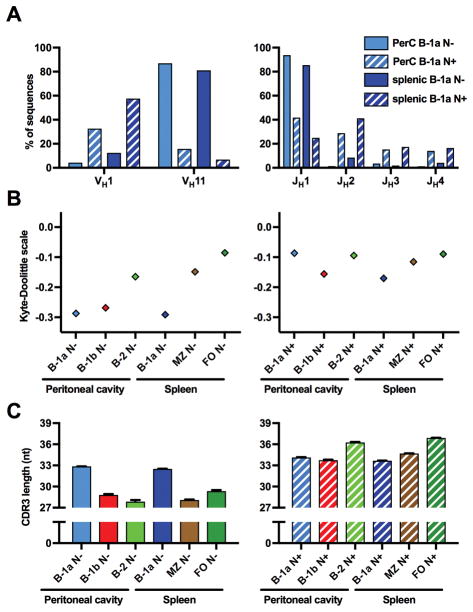
Figure 4. B-1a N+ sequences differ substantially from N− sequences.
(A) Both peritoneal and splenic B-1a N− sequences contained VH11 to a much higher amount than the respective N+ sequences. JH1 was expressed more frequently and was the predominant J segment in B-1a N− sequences. In other cell subsets, VDJ usage was not substantially different between N− and N+ sequences (not shown). (B) B-1 N− CDR3s were on average substantially less hydrophobic than the CDR3s of all other subsets, including B-1 N+ sequences. (C) CDR3s of N− sequences were markedly shorter on average, except in B-1a sequences, for which N+ and N− CDR3s were roughly the same length.
Each value in A is displayed as a proportion of total sequences. In B and C, values are displayed as mean ± SEM (error bars were too small to be accurately displayed for hydrophobicity).
One-way ANOVA: Hydrophobicity: p > 0.05: PerC B-1a N− vs. splenic B-1a N−, PerC B-1a N+ vs. B-2 N+, PerC B-1a N+ vs. FO N−, PerC B-1a N+ vs. FO N−, B-1b N+ vs. B-2 N−, B-2 N− vs. splenic B-1a N+, B-2 N− vs. MZ N−, B-2 N+ vs. FO N−, B-2 N+ vs. FO N−, B-2 N+ vs. FO N+, FO N− vs. N+. p < 0.01: all other comparisons. CDR3 length: p > 0.05: B-1b N− vs. FO N−, B-1b N+ vs. splenic B-1a N+, B-2 N− vs. MZ N−). p < 0.001: all other comparisons.

