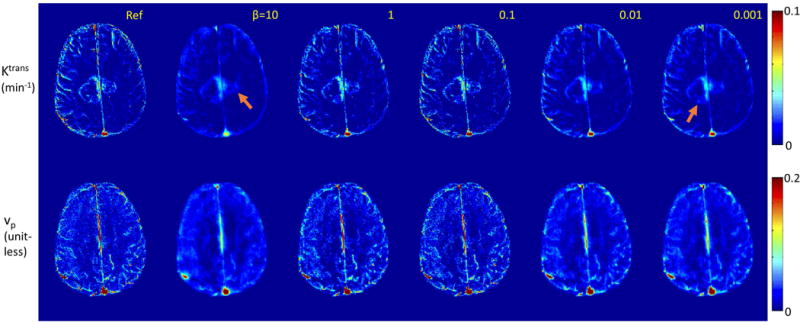
Figure 4.

Reconstruction of the TK maps of one representative in-vivo brain tumor case using the Patlak model at R=60x and 100x. Tumor ROI (indicated in the reference images) histograms are shown below the respective cases. Detailed evaluation of the ROI Ktrans histograms by skewness, 90%ile, and nRMSE are shown in Figure 6.
