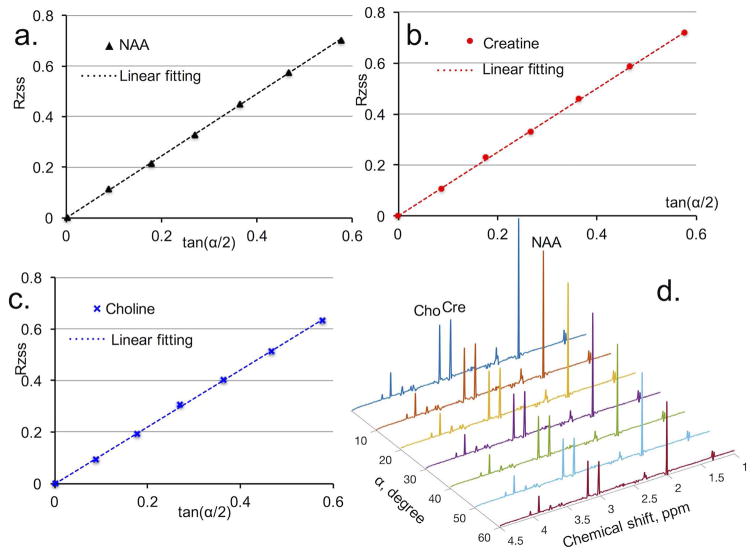
Figure 3.
Phantom metabolite T2 determination with proposed Multiple flip Angle pulse driven Ratio of longitudinal Steady States (MARZSS). (a) Linear fitting as black dotted line for N-acetylaspartase (NAA) data points, extracted with LCModel from spectra in Fig. 3d. (b) Linear fitting as red dotted line for creatine (Cr) data points, extracted from spectra in Fig. 3d. (c) Linear fitting as blue dotted line for choline (Cho) data points, extracted from spectra in Fig. 3d. (d) Signal variation with flip angle in phantom measurements of NAA, Cr, and Cho. Metabolite spectra were acquired with flip angle from 0° to 60° with 10° increment.

