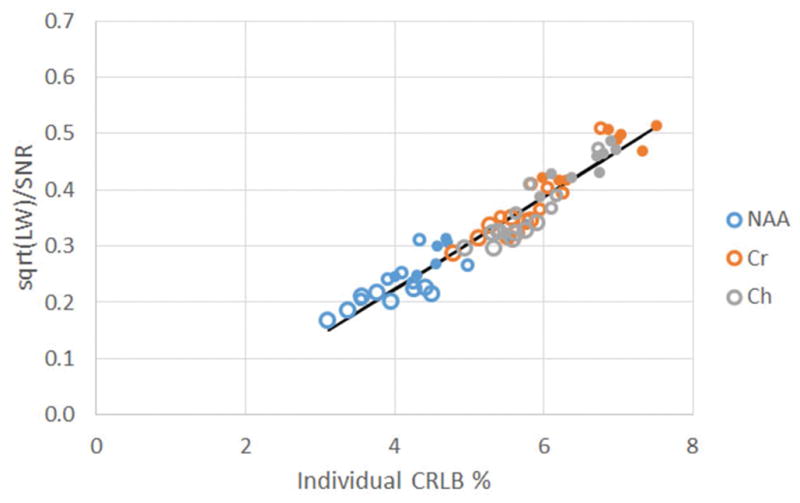
Figure 3.

Based on the anticipated relationship between CRLB, SNR and linewidth (Eq. 3), the variable spectral quality datasets show a highly significant regression between the individual CRLB (x value) and (y value) for NAA, Cr or Ch averaged from the frontal parcel. Color indicates metabolite (blue NAA, red Cr, gray Ch); largest open circles are from 9.6 min, medium open circles 6.0 min, filled circles 4.8 min.
