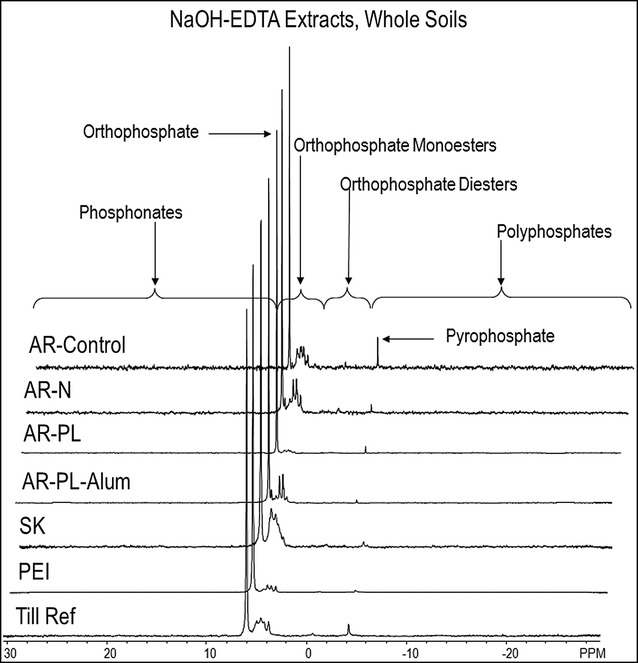
Fig. 2.

P-NMR spectra of whole soil samples extracted with NaOH-EDTA. Spectra are plotted with 7 Hz line-broadening and scaled to the height of the orthophosphate peak

P-NMR spectra of whole soil samples extracted with NaOH-EDTA. Spectra are plotted with 7 Hz line-broadening and scaled to the height of the orthophosphate peak