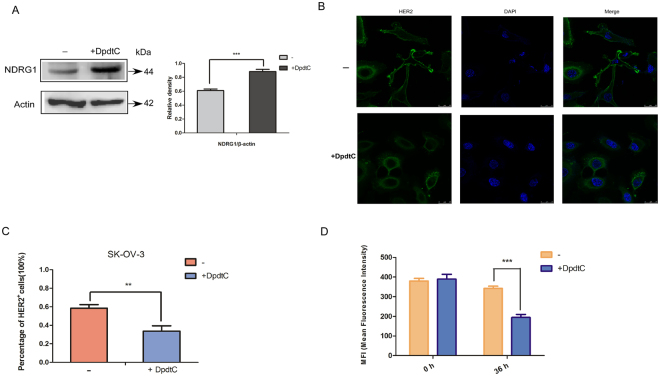
Figure 3.
DpdtC up-regulated NDRG1 expression and down-regulated membrane expression of HER2 on SK-OV-3 cells. (A) SK-OV-3 cells were incubated for 24 h at 37 °C with control media (−) or media containing the DpdtC (2 μM), and NDRG1 level was examined by western blot. And quantification of western blot signal intensity analysis is expressed relative to the β-actin loading control by using Image J software. ***p < 0.001. (B) Representative micrographs of fluorescent immunostaining showed that DpdtC decreased HER2 expression at the cell membrane. Cells were incubated for 36 h at 37 °C with control media (−) or media containing the DpdtC (2 μM), and HER2 localization was examined via immunofluorescence. Original magnification, ×600. Scale bars, 25 μm. (C) Percentage of HER2-positive stained cells reduced markedly in SK-OV-3 cells when incubated with DpdtC. Data are expressed as mean ± SD of the integrated fluorescence signals from 3 fields for each specimen. (D) Flow cytometry assay quantifying the membrane expression of HER2 on SK-OV-3 cells, which was expressed as MFI (Median Fluorescence Intensity) upon treatment control media (−) or media containing the DpdtC (2 μM) for 36 h at 37 °C. **p < 0.01; ***p < 0.001.

