Figure 4.
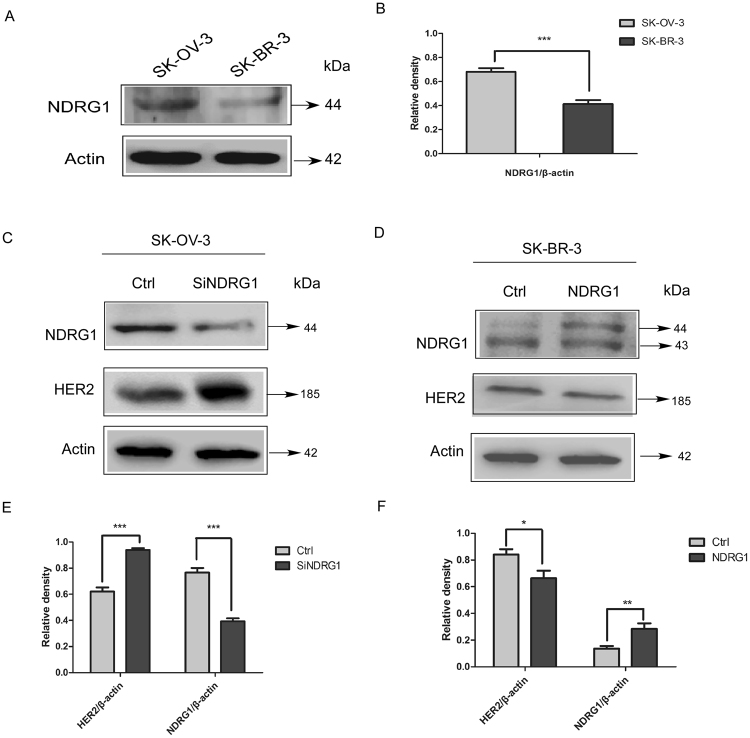
NDRG1 expression decreased HER2 level in both SK-OV-3 and SK-BR-3 cells. (A) Western blot indicating the expression of NDRG1 in SK-OV-3 and SK-BR-3 cells. (B) Quantification of western blot signal intensity analysis is expressed relative to the β-actin loading control by using Image J software. (C) Suppression of NDRG1 by siRNA leaded to increase in the level of HER2 in SK-OV-3 cells. SK-OV-3 cells were transiently transfected with nonspecific control siRNA (Ctrl) or NDRG1 siRNA (siNDRG1) for 72 h at 37 °C. (D) NDRG1 expression inhibits HER2 expression in SK-BR-3 cells. The plasmid of pCDNA3.1-NDRG1 or the vector control (Ctrl) was constructed and transfected into SK-BR-3 cells. (E) Quantification of western blot signal intensity analysis in SK-OV-3 cells is expressed relative to the β-actin loading control by using Image J software. (F) Quantification of western blot signal intensity analysis in SK-BR-3 cells is expressed relative to the β-actin loading control by using Image J software. Data show the mean ± SD (3 independent experiments); *p < 0.05; **p < 0.01; ***p < 0.001.

