
Figure 2.
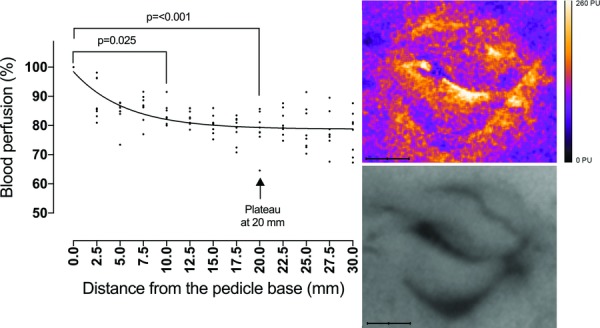
Laser speckle contrast imaging measurements showing a decrease in perfusion along the length of a full-thickness eyelid flap as the percent decrease in blood perfusion at increasing distance from the pedicel base. Nonlinear regression analysis showed that perfusion reached a plateau and stabilized at 20 mm from the base (95% CI, 16-23). Statistical analysis was performed using the Friedman matched-pair test with Dunn's posttest (n = 8). The images on the right are representative examples of the laser speckle pattern (top) and the corresponding grayscale image (bottom) of the upper and lower eyelids.