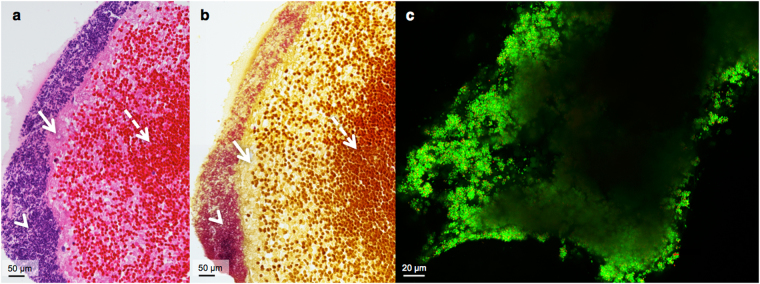
Figure 1.
Cross-sectional histological staining and confocal laser scanning microscopy of the infected clot model. Both a and b are each composed of two combined microscope images acquired at 40x magnification. (a) Image of H&E staining of an infected clot cross-section. The arrowhead indicates bacteria (purple), the arrow points at fibrin (pink), and a dashed-line arrow at erythrocytes (red). (b) Crystal violet staining, where an arrowhead indicates bacteria (purple), an arrow for fibrin (yellow), and a dashed-line arrow for erythrocytes (brown). (c) ImageJ maximum intensity projection of live (green, SYTO 9 stained) and dead (red, PI stained) S. aureus comprising the outer layer of a representative infected clot.

