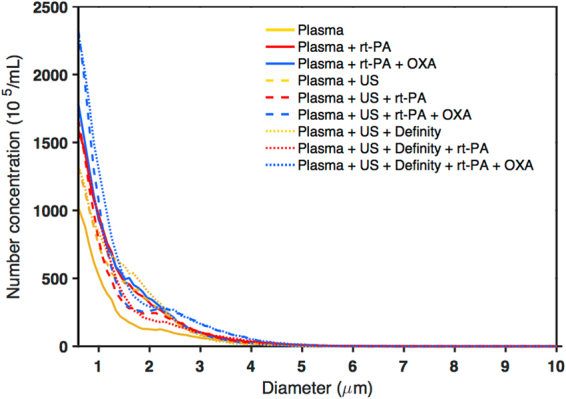
Figure 6.

Effluent characterization using particle size measurement with the Coulter counter. Colours and line style represent different treatment groups with yellow indicating no rt-PA or oxacillin, red indicating rt-PA without oxacillin, and blue indicating oxacillin addition (n = 3 per group; line represents the average). Dashed lines indicate treatment with ultrasound; dotted lines indicate treatment with ultrasound and Definity. The number-weighted particle size distribution is shown with the background subtracted. US = ultrasound and OXA = oxacillin.
