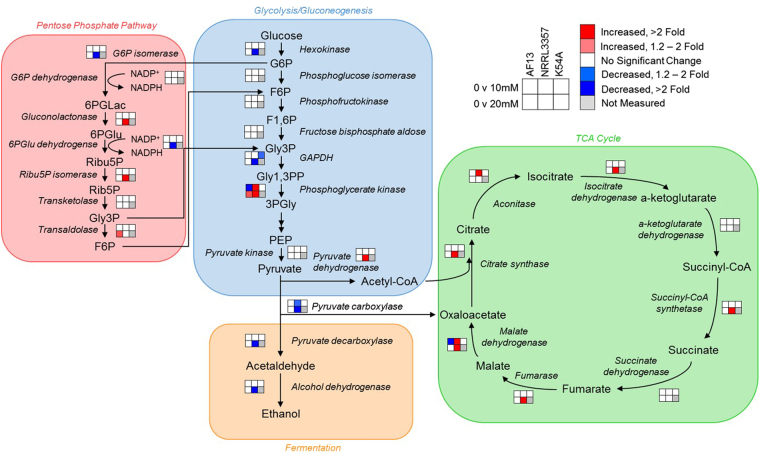
Figure 4.
Carbohydrate metabolic pathway components differentially expressed in response to increasing oxidative stress. Enzymes found to be differentially expressed in the glycolysis/gluconeogenesis (blue), pentose phosphate (red), fermentation (yellow), and tricarboxylic acid (TCA) cycle (green) pathways are plotted based on their associations found in the KEGG database. Larger fonts correspond to compounds in the pathways while smaller, italicized fonts represent enzymes. The 2 × 3 heatmaps represent each isolate and fold change in expression observed relative to the control for each H2O2 treatment. Red and blue colors represent significantly higher and lower expression, respectively; white color represents no significant change in expression; and gray color represents treatments not measured in this experiment. Abbreviations: G6P, glucose-6-phosphate; F6P, fructose-6-phosphate; F1,6 P, fructose-1,6-bisphosphate; Gly3P, glyceraldehyde-3-phosphate; Gly1,3PP, glyceraldehyde-1,3-bisphosphate; PEP, phosphoenolpyruvate; 6PGLac, 6-phosphogluconolactone; 6PGlu, 6-phosphogluconate; Ribu5P, ribulose-5-phosphate; Rib5P, ribose-5-phosphate.

