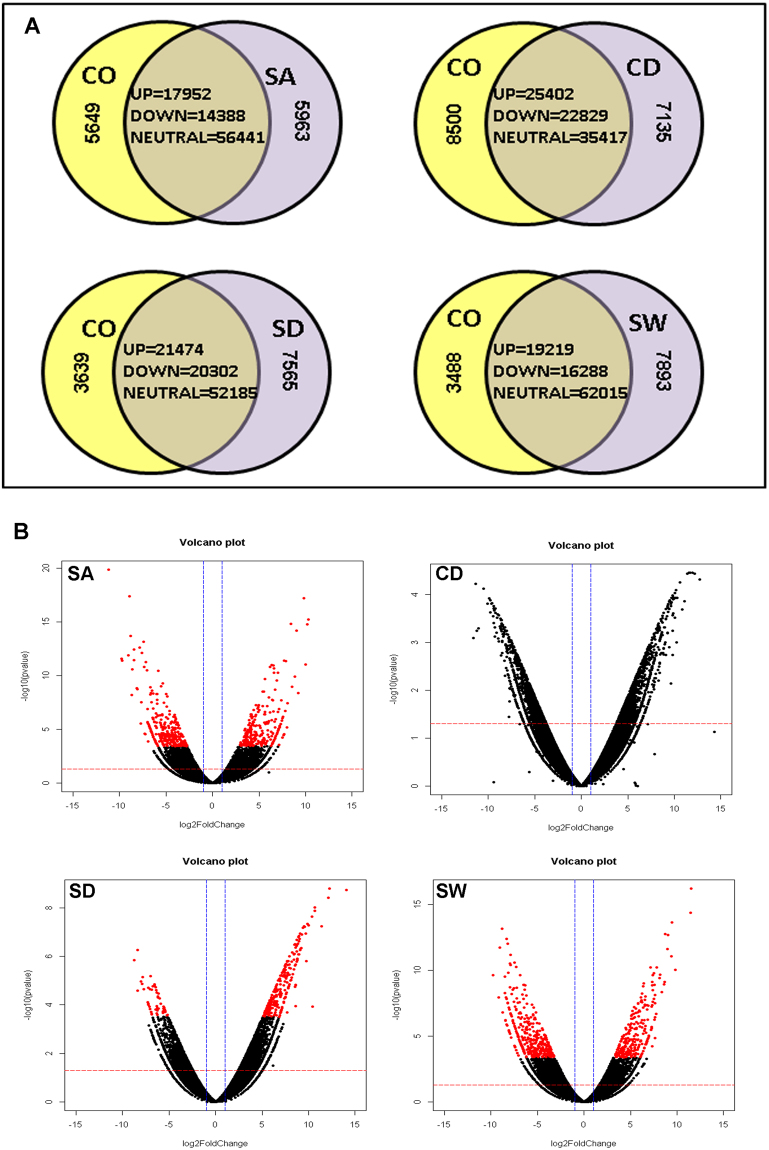
Figure 1.
Distribution of DEGs. (A)Venn diagrams showing common and exclusive transcripts. The over-lapping regions display the common transcripts (up-regulated, down-regulated and neutral) between control and stress. (B) Volcano plots displaying differentially expressed transcripts. Each dot represents a DEG, dots above the red line display the significant DEGs (p < 0.05) and red dots indicate highly significant DEGs (q value < 0.05). Abbreviations used: CO (control sample), SA (salt), CD (cold), SD (drought), SW (water-logging), UP (up-regulated transcripts), DOWN (down-regulated transcripts), neutral (transcripts that did not exhibit a differential expression).

