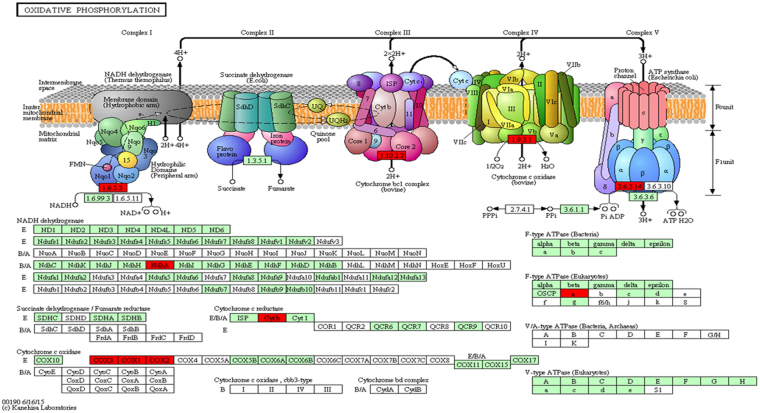
Figure 4.
KEGG pathway diagram for oxidative phosphorylation. Oxidative phosphorylation emerged as the most significantly enriched pathway when transcripts showing expression only in control sample were subjected to KOBAS. The upper part of the figure displays the respiratory chain complexes and the lower portion represents their subunits as rectangles (red ones are the transcripts unique to control sample when compared to stress the bottom part, rectangles indicate the subunits of each respiratory chain complex. Red colored boxes represent the genes that were present exclusively in control sample whereas green boxes represent the genes present in reference organism65–68.

