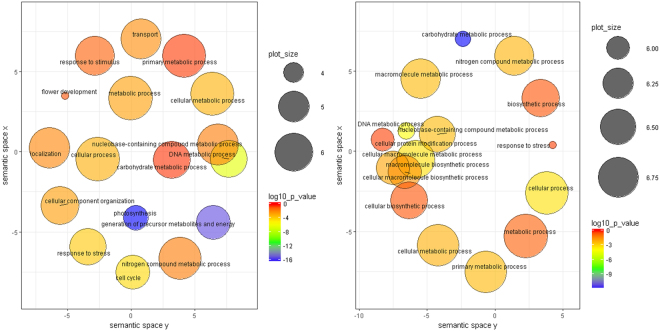
Figure 5.
GO enrichment analysis visualized by REVIGO. Significantly enriched GO terms related to biological processes for transcripts exhibiting co-up-regulation (left one) and co-down-regulation (right one). Clustering of circles (representing GO terms) was based on semantic similarities to other GO terms in the gene ontology (larger circles represent more general terms whereas adjoin circles depict close relationship). Size and color of the circle represent the GO term frequency and the log10P-value for the enrichment derived from the AgriGO analysis (red higher, blue lower) respectively.

