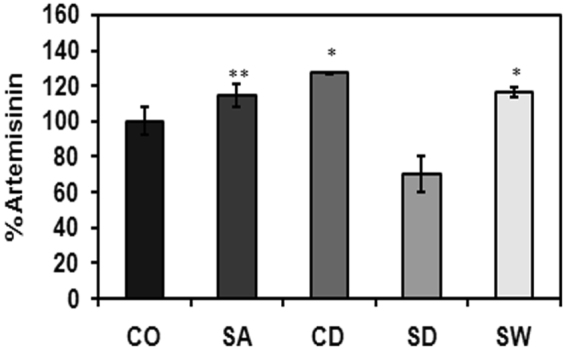
Figure 8.

Estimation of artemisinin content. Artemisinin content was quantified as % dry weight of the leaves in the leaves of A. annua (CO) control, (SA) salinity, (CD) cold, (SD) drought and (SW) water-logging samples. The data was analyzed by three independent repeats, and standard deviations were shown with error bars. Significant differences between control and stress were indicated by ‘*’ for p-value ≤ 0.05 and ‘**’ for p-value ≤ 0.001.
