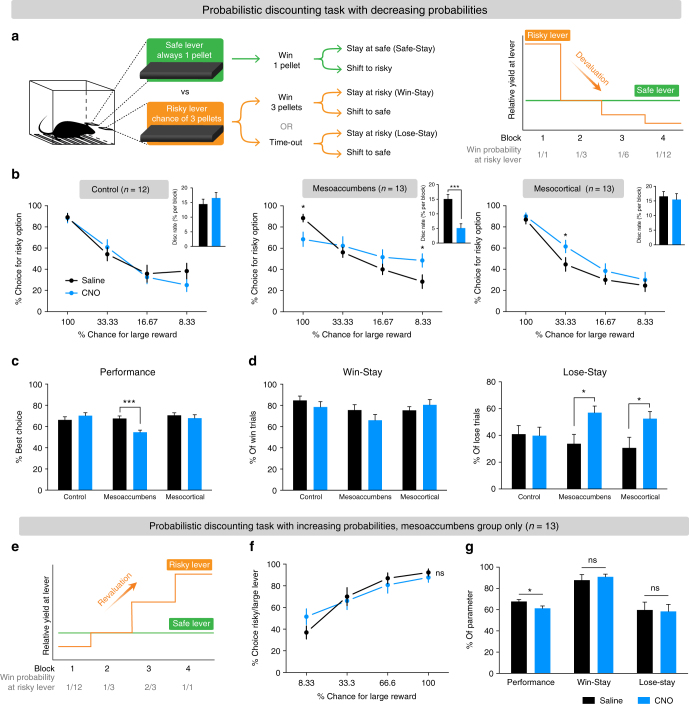
Fig. 4.
Chemogenetic activation of the mesoaccumbens and the mesocortical pathway alters probabilistic discounting. a Task design. b Discounting curves for individual groups. (Left panel) Sham control group (saline vs CNO; Sidak’s test, p > 0.1 for all blocks). (Middle panel) During mesoaccumbens hyperactivity, animals have a smaller preference for the risky lever in the first block (Sidak’s test, p = 0.0468), a larger preference for the risky lever in the last block (p = 0.0468; blocks 2 and 3 both p > 0.1), and a significantly diminished discounting rate (inset, p = 0.0002). (Right panel) Mesocortical activation increased choice for the risky lever in the second block (Sidak’s test in block 2, p = 0.0247; blocks 1, 3, and 4, all p > 0.1). Asterisks in discounting curves indicate significant difference between saline and CNO treatment. Insets display the average steepness of the discounting curve (statistical comparison with Sidak’s test). c Mesoaccumbens activation reduces the percentage optimal choices in the probabilistic discounting task (i.e., % best choice in blocks 1, 3, and 4; two-way ANOVA; effect of CNO, p = 0.0331; group×CNO interaction, p = 0.0016; post-hoc Sidak’s test, p = 0.5082 for control group, p = 0.0004 for mesoaccumbens group, p = 0.7533 for mesocortical group). d Chemogenetic activation of the mesoaccumbens or mesocortical pathway had no effect on win-stay behavior (two-way ANOVA; effect of CNO, p = 0.36; group×CNO effect, p = 0.26), but did increase lose-stay behavior (two-way repeated ANOVA; effect of CNO, p = 0.0026; group×CNO effect, p = 0.0622; post-hoc Sidak’s test, p = 0.9988, p = 0.0177 and p = 0.0203 for control, mesoaccumbens, and mesocortical groups, respectively). e Task design of the probabilistic discounting task with increasing probabilities. f Mesoaccumbens activation did not affect the discounting curve (Sidak’s test in every block, p > 0.1). g Mesoaccumbens activation decreased performance on the task (paired t-test, p = 0.0143), but not win-stay (paired t-test, p = 0.32) or lose-stay behavior (paired t-test, p = 0.85). Data are shown as mean ± standard error of the mean; ns not significant, *p < 0.05, ***p < 0.001

