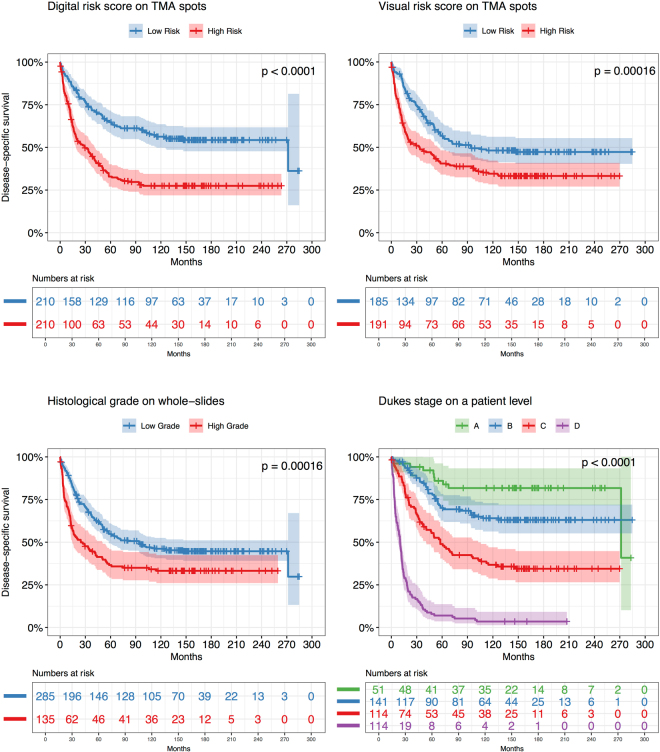
Figure 2.
Kaplan-Meier survival curves based on different predictors for 420 colorectal cancer patients. We dichotomized patients into Low Risk group (blue curve) and High Risk group (Red curve) by median value of each predictor independently. The LSTM model predictor yields stronger stratification with a Hazard Ratio (HR) of 2.3 (log rank p-value < 0.0001) as compared to Visual Scoring on a tissue microarray (TMA) spot level (HR 1.67; log rank p-value = 0.00016) and histological grade on a whole-slide level (HR 1.65; log rank p-value = 0.00016). Dukes’ stage also stratifies the patients into groups with significantly different outcome (p-value < 0.0001). Dukes’ stage remains a stronger predictor of survival, but is not directly comparable to the tissue-based variables, since it includes extent of local invasion, number of lymph nodes affected and whether distant metastasis is observed.

