Fig. 5.
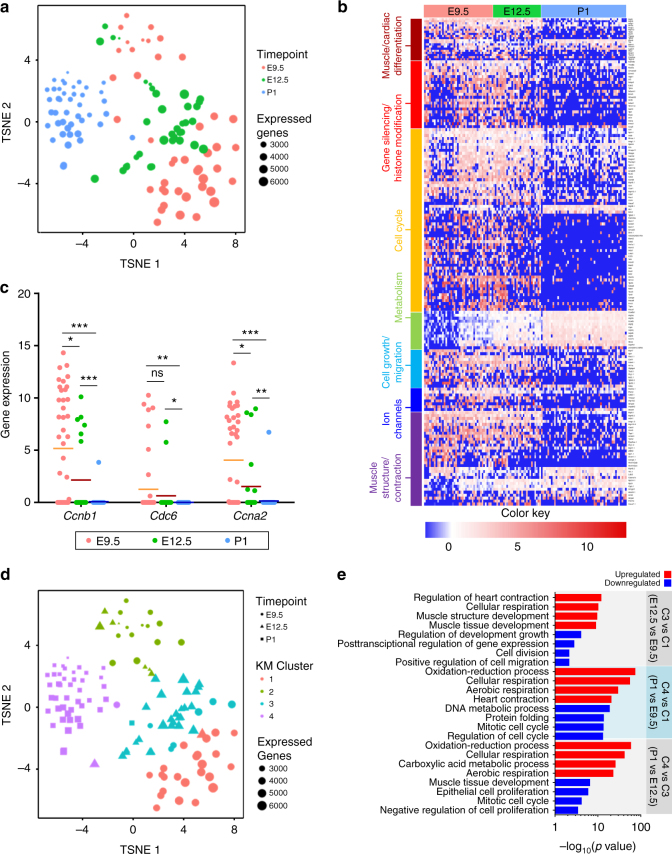
Single-cell gene expression analysis reveals heterogeneity of CMs within and between developmental time points. a t-SNE revealing distribution of single cells. b Heat map analysis of single cells from different developmental time points on genes relevant to cardiac development and maturation (E9.5: n = 42, E12.5: n = 29, P1: n = 52). The full list of genes presented in the maps is also provided in Supplementary Table 1. c Expression of cell cycle-associated genes (Ccna2, Ccnb1, Cdc6) from individual cells at each time point confirming a decline in cell cycle activity from E9.5 to P1 (Student’s t test), *p < 0.05, **p < 0.01, ***p < 0.001. Mean depicted as solid line. d t-SNE with k-m-based clustering identifies four distinct clusters. e Gene ontology analysis of upregulated and downregulated genes between different clusters

