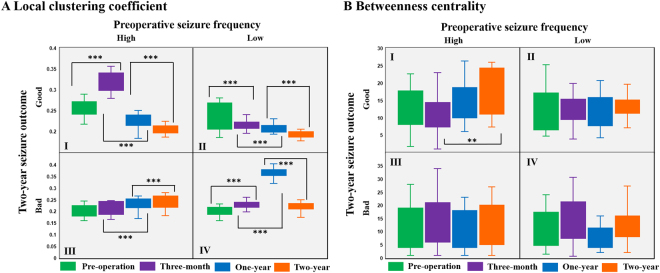
Figure 3.
Comparisons of local network parameters including (A) local clustering coefficient (LCC) and (B) betweenness centrality (BC). Patients in group I showed increased LCC (p < 0.001) three-months after surgery and decreased LCC (p < 0.001) at one-year and two-year post-operation (repeated measures ANOVA, F3,15 = 3.876, p = 0.031, Bonferroni post-hoc tests). For group II, LCC decreased (p ≤ 0.001) at the two-year follow-up compared to the pre-operation value (repeated measures ANOVA, F3,30 = 3.022, p = 0.045, Bonferroni post-hoc tests). Both groups III and IV showed an increased LCC (p < 0.001) after CC at one-year follow-up; group III increased further at the two-year state (repeated measures ANOVA, F3,15 = 4.101, p = 0.026, Bonferroni post hoc tests) whereas group IV decreased (repeated measures ANOVA, F3,18 = 4.495, p = 0.016, Bonferroni post hoc tests). The LCC in a fully-connected network equals 1. BC in Group I slightly decreased three-months after CC and then showed a significant increase (p < 0.05) after two years of recovery, whereas no clear changes were seen in the other groups (repeated measures ANOVA, F3,15 = 4.006, p = 0.028, Bonferroni post hoc tests).

