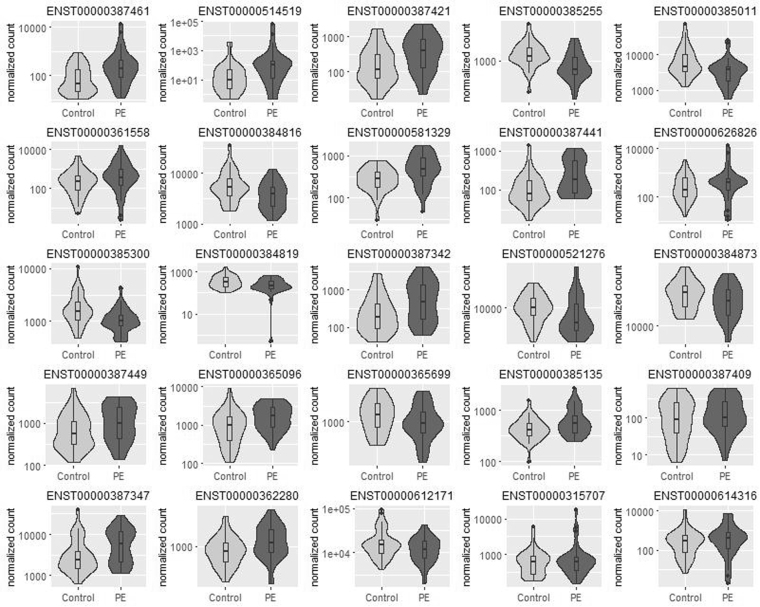
Figure 1.
Normalized counts for differentially expressed transcripts in PE vs. control samples. Each of the most highly abundant transcripts in 35 PE vs. 40 control samples was tested for differential expression, and 25 transcripts were found to be differentially expressed (adjusted p-value < 0.05). Normalized counts are presented as violin and box plots. The upper and lower limits of the boxes represent the 75th and 25th percentiles. The upper and lower whiskers represent maximum and minimum values. The median is indicated by the line in each box. Outliers are indicated by circles.

