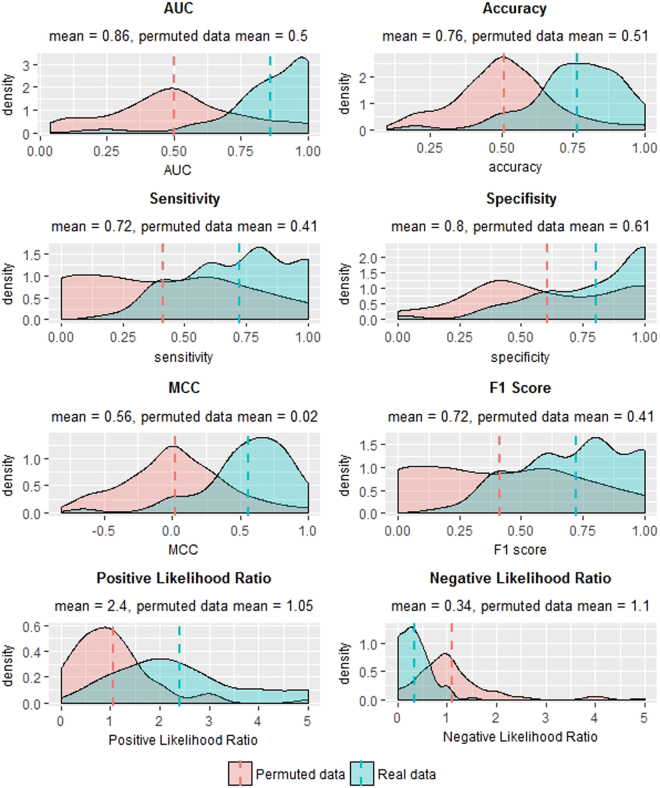
Figure 3.
Classification results on real and permutated data sets. Density plots of statistical measures obtained by 100 iterations of our classification procedure on real (blue) and permutated (red) data sets. Real dataset included 35 PE and 40 control samples. Permutated dataset included the same samples after random shuffling of their conditions (i.e., PE/control). Means are indicated as well. Sensitivity: true positives out of all positives; Specificity: true negatives out of all negatives; Accuracy: true classifications out of all classifications; Matthews’s correlation coefficient (MCC): a correlation coefficient between the observed and predicted binary classifications; AUC: area under the ROC curve; F1 Score: the harmonic mean of precision and sensitivity; Positive Likelihood Ratio: sensitivity/(1-specificity); Negative Likelihood Ratio: (1-sensitivity)/specificity.

