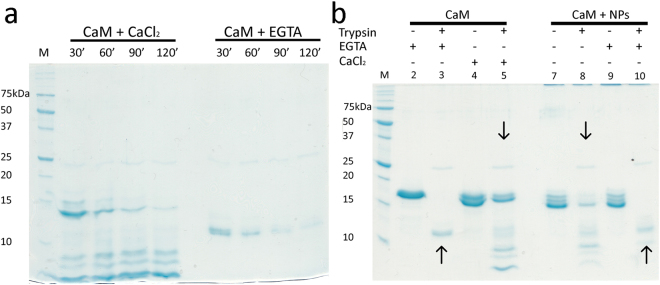
Figure 2.
Limited proteolysis pattern of CaM in the presence and in the absence of NPs. (a) Proteolysis reactions were performed at 25 °C by 30–120 min incubation with saturating (2 mM) EGTA or Ca2+, using a CaM:TPCK-trypsin ratio equal to 1:60. Lane M refers to the protein marker. (b) Proteolysis experiments in the presence of NPs were performed by 30 min incubation with saturating (240 µM) EGTA or Ca2+, using a CaM:TPCK-trypsin ratio equal to 1:60. Lanes 3 and 5 refer to the digested apo (lane 3) and Ca2+-bound (lane 5) CaM. Lanes 8 and 10 refer to the digested CaM previously incubated with NPs (lane 8) and after the addition of EGTA (lane 10). Undigested CaM was loaded in the same conditions in lanes 2, 4, 7 and 9. The similar effect exerted by either free Ca2+ or NPs and excess EGTA on the proteolytic patterns is highlighted by downwards and upwards arrows, respectively. The figure results from two separate gels, which have been reported in full-length in Supplementary Figure S1.

