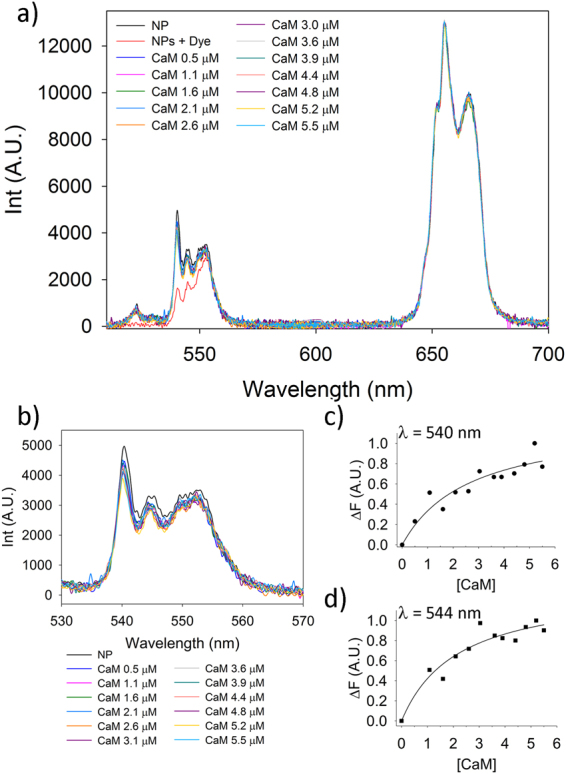
Figure 6.

RET analysis of CaM-NP interaction (a) Upconversion spectra of CaF2 NPs in CaM titration experiments. The resonance energy transfer (RET) phenomenon is evident by a strong decrease of the Er3+ emission in the 520–560 nm optical range. Band assignment: (i) 2H1/2→4I15/2; (ii) 4S3/2→4I15/2; (iii) 4F9/2→4I15/2. (b–d) Example of titration experiments of Alexa Fluor 532-conjugated CaM with a 0.5 mg/mL NPs dispersion. (b) Zoom of the spectral area showing the RET phenomenon. Notice the change in NPs emission at 540 (c) and 544nm (d).
