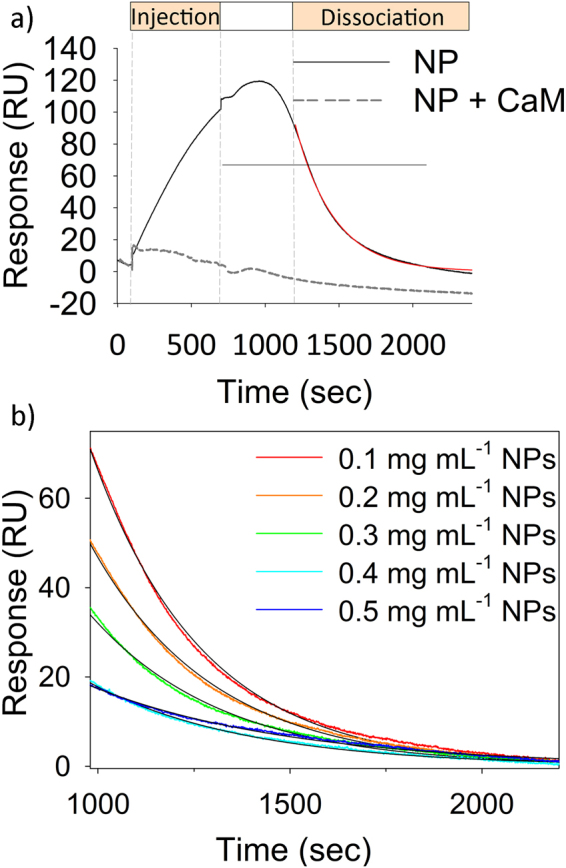
Figure 7.

SPR analysis of CaM-NP interaction. (a) Example of sensorgram obtained by flowing NPs (0.1 mg/mL) on a flow cell, where 2400 RU of CaM were previously immobilized via amine coupling. Injection was performed for 600 s (flow rate 10 µL/min) and dissociation was followed for 1800 s. The red curve refers to data fitting using a single exponential function. The dashed grey line refers to injection of the same amount of NPs previously incubated with 1.6 µM CaM. (b) Example of dissociation curves obtained by SPR overlapped to the fitting curves according to a single exponential in the 0.1–0.5 mg/mL NP range.
