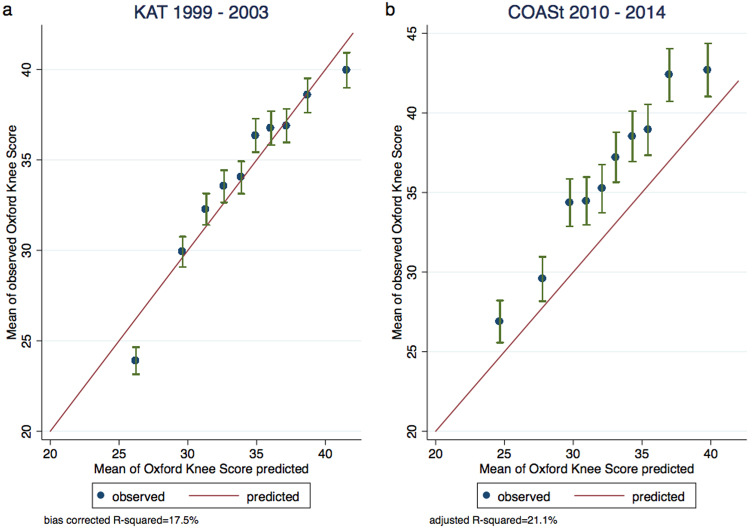
Figure 1.
Calibration plot with R2. (a) Calibration plot of the imputed development dataset (n = 1,649). (b) Calibration plot of the external dataset also imputed (n = 595). Internal and external samples used for validation were divided in 10 deciles, according to their predicted risk. For each decile, the mean predicted risk and the mean observed cases are shown on the X and Y axes, respectively. Bars indicate 95% Poisson confidence intervals.

