Figure 1.
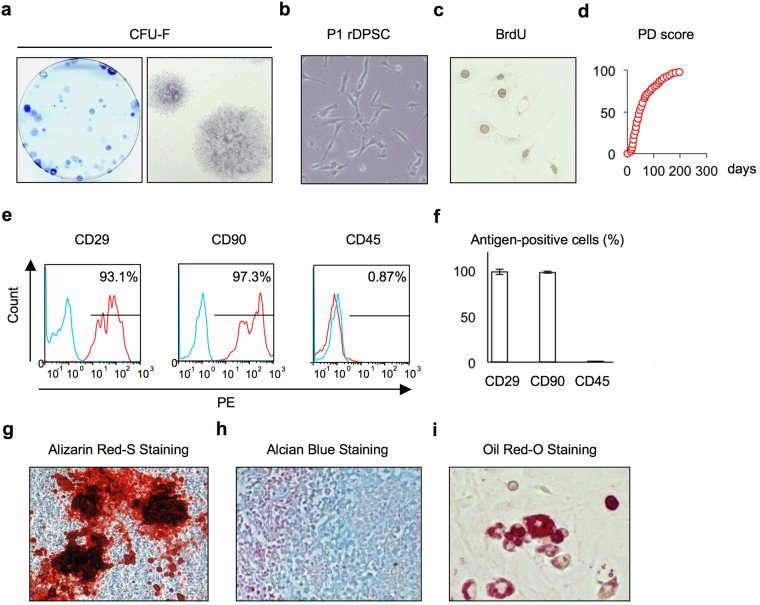
Characterization of rat dental pulp stem cells (rDPSCs). (a) Colony-forming capability of rDPSCs as shown by toluidine blue staining. Representative images of colony-froming unit fibroblats (CFU-Fs) in a culture dish (left panel) and fibroblastic colonies (right panel). (b) Representative image of passage 1 (P1) rDPSCs. (c) Representative image of rDPSCs with BrdU-positive nuclei. (d) Population doubling (PD) score of rDPSCs. (e,f) Immunophenotype assay by flow cytometric analysis. Red histograms: cell surface antigen-specific antibodies; blue histograms: subclass-matched control antibodies. Percentiles indicate the average for each antigen. PE: phycoerythrin (e). Percentiles of cell surface antigen-positive cells among total cells (n = 3 per group). Graph bars are the means ± standard error of the mean (SEM) (f). (g–i) Multipotency of rDPSCs. Odontogenic/osteogenic (g), chondrogenic (h), and adipogenic (i) capacity.

