
Figure 3.
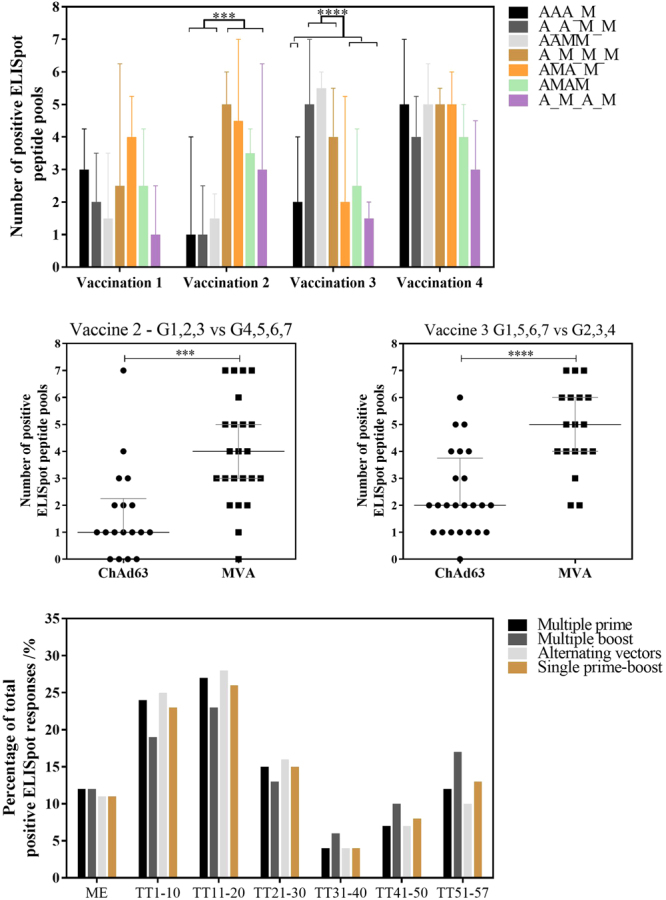
Breadth of T cell response. (A) Response breadth by number of positive ELISpot pools per group at the peak post vaccination: 14–28 days post-ChAd63 ME-TRAP and 7–28 days post-MVA ME-TRAP. Median plus interquartile range displayed to a maximum of 7 pools: TRAP T9/96 (TT) pool 1–6 and multiple epitope pool. Response breadth to ChAd63 ME-TRAP and MVA ME-TRAP by Mann-Whitney test at vaccination 2 and 3, p = 0.0002 and p < 0.0001 respectively, as shown in 2B and 2 C. ***p < 0.001, ****p < 0.0001. 3 C) Distribution of positive responses toward each ELISpot pool, as a proportion of overall positive responses. Groups combined to assess multiple prime (group 1 AAA_M, group 2 A_A_M, group 3 AAM), multiple boost (group 4 A_M_M_M), alternating vectors (group 5 AMA_M, group 6 AMAM, group 7 A_M_A_M) and single prime boost (group 5 + 6 AM, group 4 + 7 A_M).