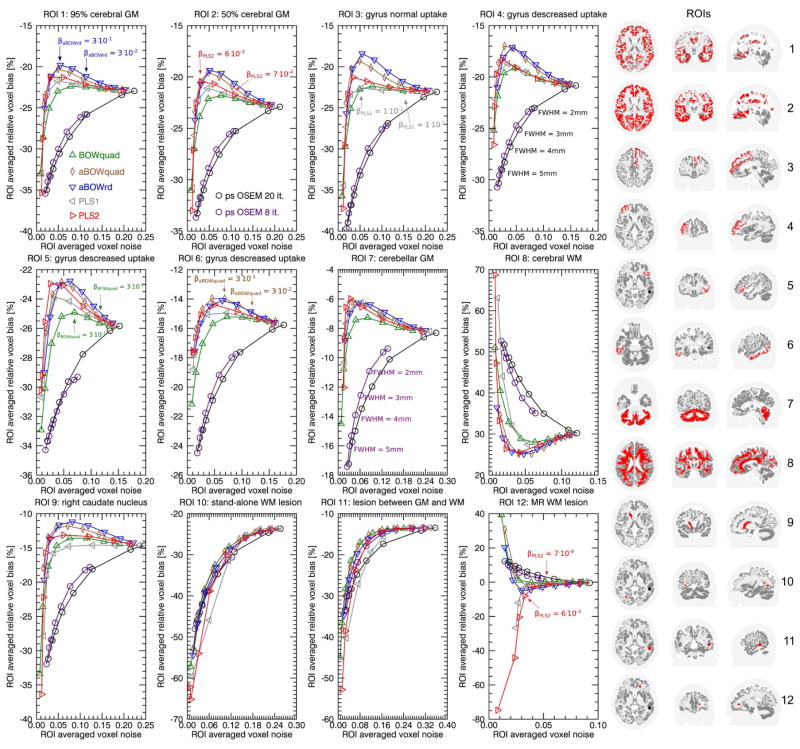
Fig. 1.
Regional bias-noise curves generated from 30 noise realizations with 108 true coincidences of the simulated 3D PET data set. The panel in the right shows transaxial, coronal and sagittal slices through the ROIs that were used in each subplot. For the reconstructions using anatomical priors there is factor of 3 difference in the prior strength between each data point. ROI 1 (95% cerebral GM) consists of all cerebral voxel with a gray matter fraction greater equal 95%. ROI 2 (50% cerebral GM) consists of all cerebral voxel with a gray matter fraction greater equal 50%. Note that the transversal, coronal, and sagittal slices that visualize the ROIs on the right differ between the ROIs.

