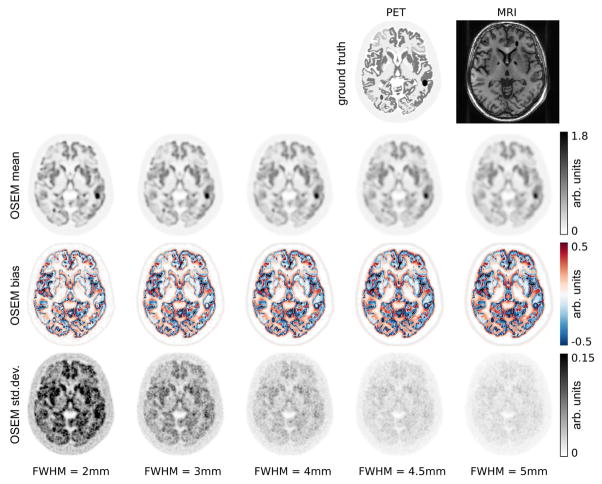
Fig. 2.
Top row: transversal slice of PET and MR ground truth images that were used to generate the simulated data. The following rows show mean, bias and standard deviation images of post-smoothed OSEM reconstructions of 30 noise realizations with 108 true coincidences of the simulated 3D PET data set. All reconstructions were done with 20 iterations and 21 subsets. For post-smoothed OSEM the results after 8 iterations and 21 subsets are shown as well. The amount of post-smoothing is shown in the bottom and increases from left to right.

