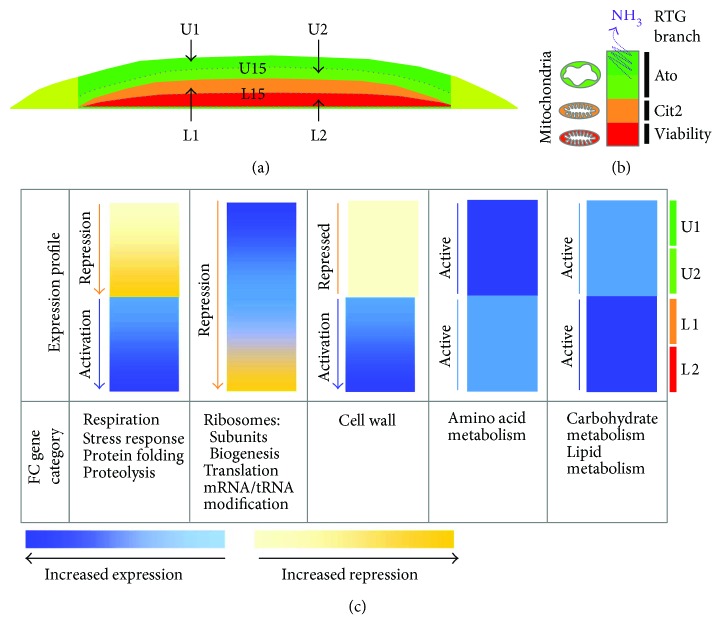
Figure 10.
Functional category (FC) expression through a yeast colony. (a) Diagram of 15-day-old colony subpopulations analyzed by RNA-seq in this study. (b) Overview of RTG regulatory pathway branches that are functional in fully differentiated 15-day-old colonies [17, 39]. (c) Based on the differential expression of constitutive genes in different population/subpopulation comparisons in 15-day-old colonies, a schematic was produced indicating expression/repression of various FCs through the colony cross-section from uppermost (U1) to lowest (L2) subpopulation in the colony centre. Increased color density corresponds to increased activation (blue) or repression (yellow) as indicated in bars below the pictures.

